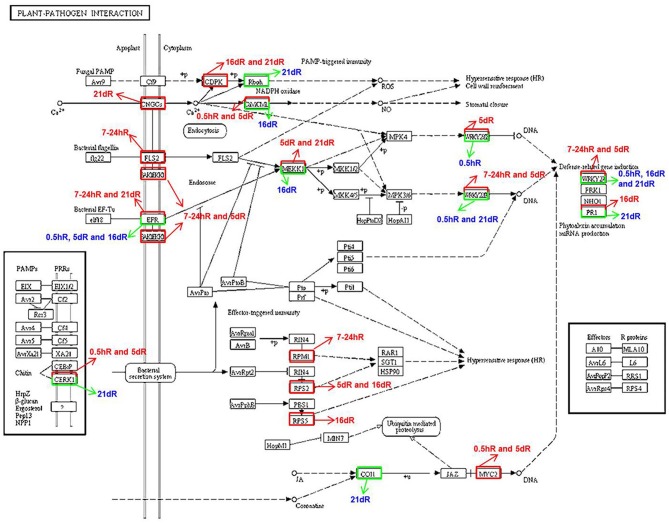
Figure 5.
Differentially expressed genes associated with the plant–pathogen interaction pathways in soybean roots at five time points after inoculation with USDA205 or 113-2. DEGs in Group 3 (USDA205 vs. 113-2, comparison between soybean roots inoculated with rhizobium strain USDA205 vs. inoculated with rhizobium strain 113-2 at 0.5 h, 7–24 h, 5 d, 16 d, and 21 d post inoculation), associated to the KEGG plant–pathogen interaction pathway in the KEGG database. Up-regulated genes are boxed in red, down-regulated genes are boxed in green. The red arrows point out the up-regulation of DEGs, the green arrows point out the down-regulation of DEGs.

