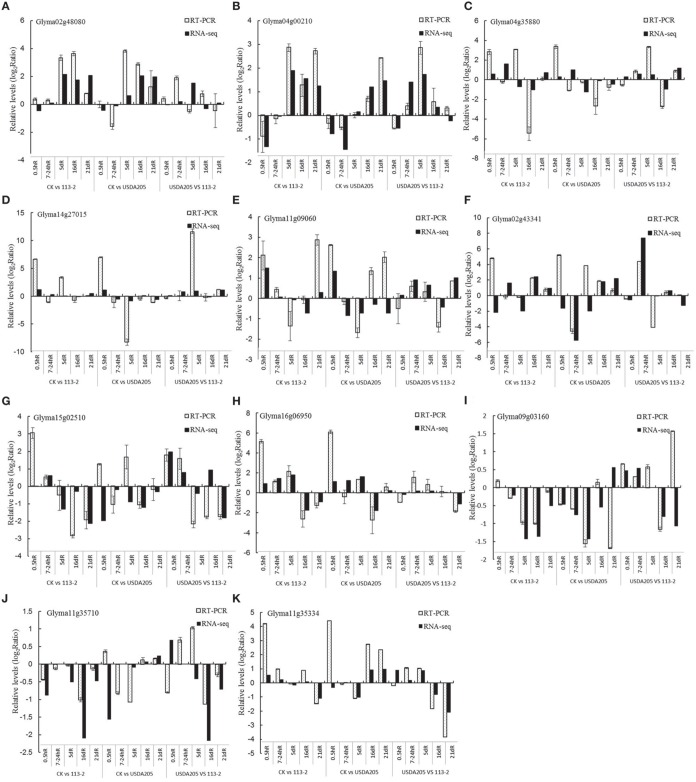
Figure 7.
Comparison of expression rates determined by RNA-Seq and qPCR on 11 genes in soybean roots. All qPCR reactions were repeated three times and the data are presented as the mean ± SD. (A), Glyma02g48080; (B), Glyma04g00210; (C), Glyma04g35880; (D), Glyma14g27015; (E), Glyma11g09060; (F), Glyma02g43341; (G), Glyma15g02510; (H), Glyma16g06950; (I), Glyma09g03160; (J), Glyma11g35710; (K), Glyma11g35334.

