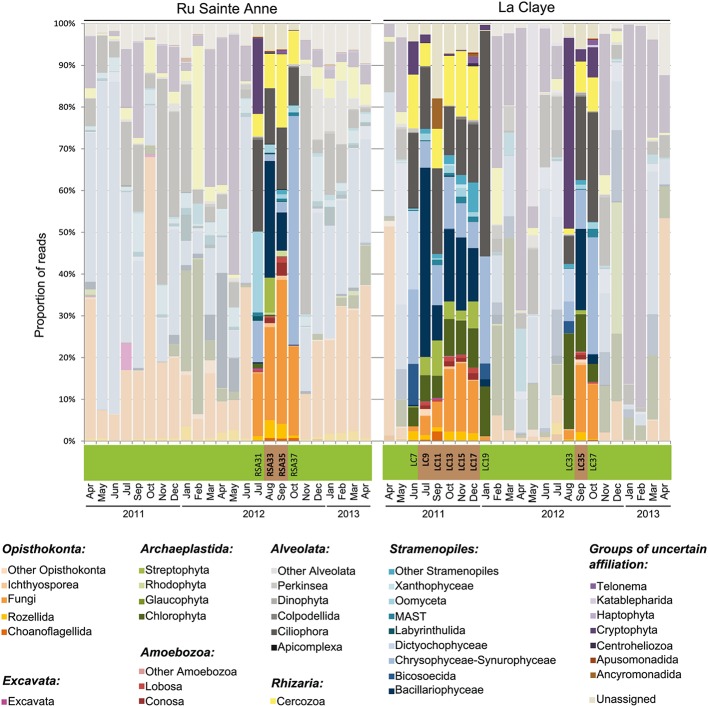
FIGURE 1.
Phylogenetic composition of microbial eukaryotic communities over a 2-years monthly temporal survey in the brook (Ru) Sainte Anne and the shallow lake La Claye. Light-colored bars correspond to plankton samples collected over the 2 years (Simon et al., 2015b). Un-masked, bright color bars show the relative proportion of eukaryotic lineages identified in dry sediment during desiccation events as well as in water samples collected in neighboring months right before and after droughts. The horizontal bar below the histograms indicates whether the corresponding histogram bars correspond to water (green) or sediment (brown) eukaryotic communities.

