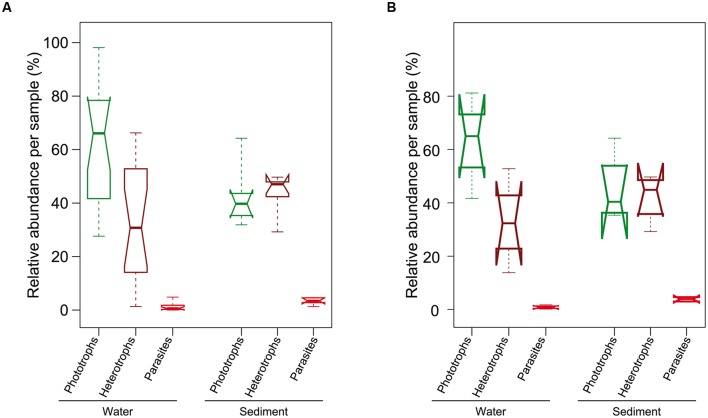
FIGURE 5.
Distribution of the relative abundance of putative phototrophs, free living heterotrophs and parasites in water and sediment samples from La Claye. (A) All samples from La Claye; (B) four sediment samples from summer and autumn 2011 and four water samples from the same period in 2012. Thick lines indicate median values. The top and below limits of boxes indicate the third and first quartile respectively. Whiskers extend to the minimal and maximal values. Notches are drawn to indicate whether medians from distinct distributions can be considered as different. Putative phototrophs, free-living heterotrophs and parasites were defined as previously (Simon et al., 2015b).

