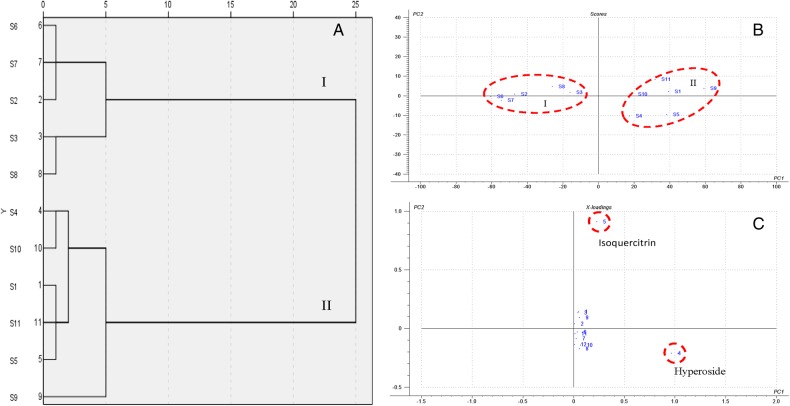
Figure 3.
Chemometric analysis of 11 batches of Receptaculum Nelumbinis samples. (A) Dendrogram for hierarchical clustering by PASW Statistics. (B) Scores plot of PCA by the Unscrambler. (C) Loadings plot of PCA for 12 peaks in their HPLC profiles by the Unscrambler. This figure is available in black and white in print and in color at JCS online.

