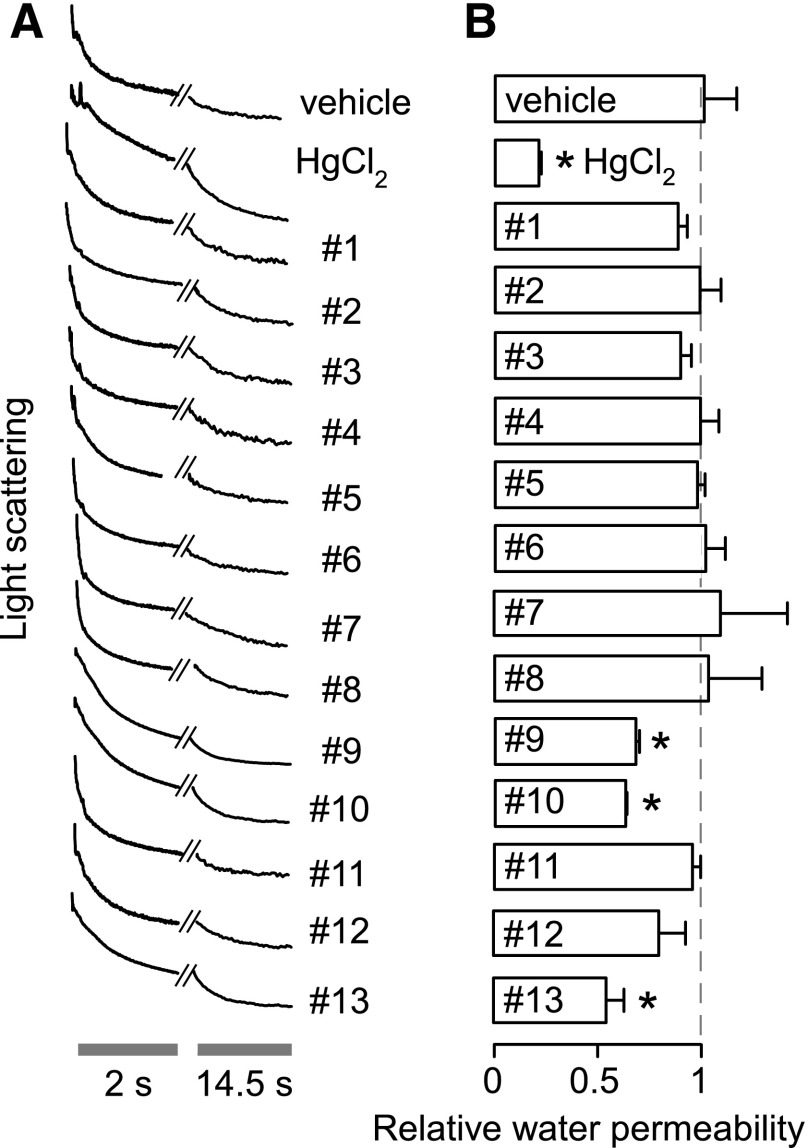
Fig. 3.
Osmotic swelling of human erythrocytes. Osmotic water permeability was measured from the time course of scattered-light intensity in response to a 150 mOsm outwardly directed osmotic gradient. (A) Representative time course data for negative control (0.5% DMSO vehicle alone), 0.3 mM HgCl2 (positive control), and indicated compounds (each 50 μM). (B) Relative osmotic water permeability (S.E., n = 4). *P < 0.05 compared with negative control (0.5% DMSO vehicle alone). Cells and ghosts were incubated with test compounds for ∼15 minutes before measurements.

