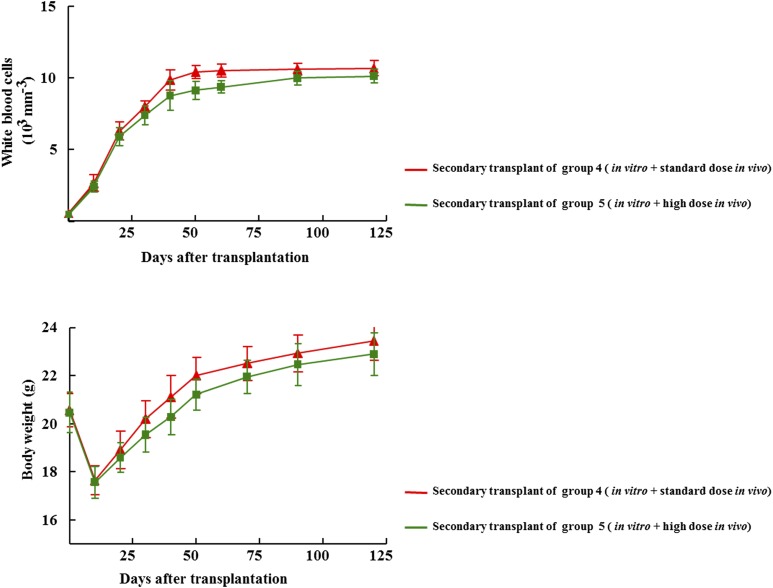
Fig. 6.
Time-dependent change in peripheral white blood cell counts (upper graph) and body weight (lower graph) after transplantation of bone marrow cells obtained from primary recipients. One-hundred, sixty days after transplantation four mice originating from treatment group 4 and group 5 respectively, were sacrificed, their femurs were flushed with phosphate-buffered saline to recover bone marrow cells. Subsequently, 2 × 10⁶ bone marrow cells were transplanted into lethally irradiated secondary recipient mice. All mice that received this secondary transplant survived. At the indicated time points, blood was drawn, the white blood cell count was determined, and the weight of the mice recorded. Data are means ± S.E.M.

