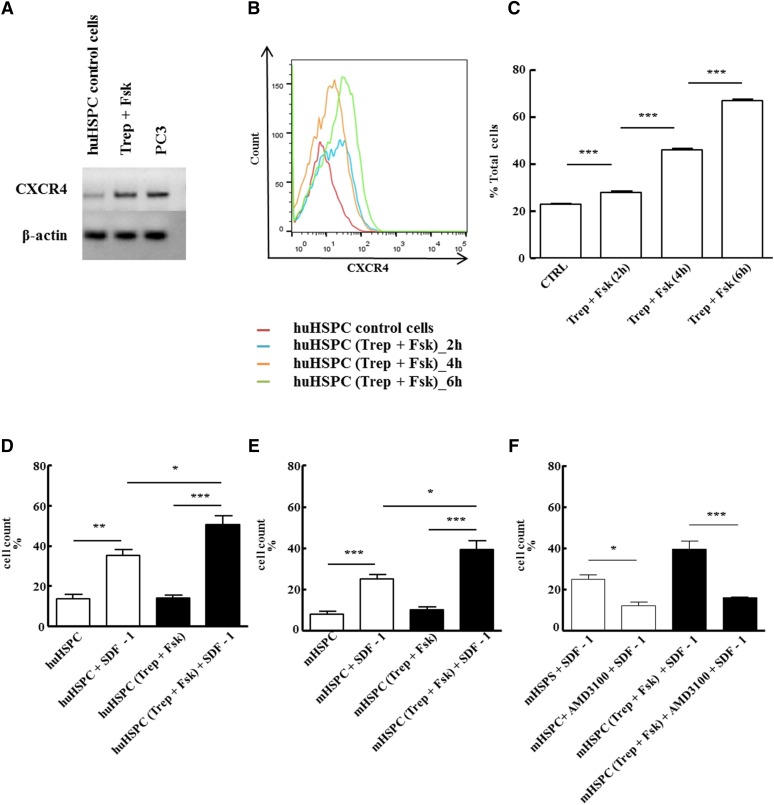
Fig. 8.
In vitro pretreatment with treprostinil and forskolin enhances the action of SDF-1 via CXCR4. (A) RNA was isolated from human HSPCs that had been incubated in the absence (control) or presence of the combination of 10 μM treprostinil and 30 μM forskolin (Trep + Fsk) for 1 hour. RNA prepared from the human prostate cancer cell line PC3 served as positive control. After reverse transcription, PCR-dependent amplification was done using primers listed in Table 1. Amplicons for CXCR4 were electrophoretically resolved on an agarose gel and visualized by ethidium bromide staining. The mRNA encoding β-actin was amplified as internal control. The data are representative of two additional experiments with similar results. (B, C) Human HSPCs were incubated in the absence (red trace = vehicle control) or in the presence of the combination of treprostinil (10 μM) and forskolin (30 μM) for 2 hours (blue trace), 4 hours (orange trace), and 6 hours (green trace) at 37°C and stained for CXCR4 with an allophycocyanin-labeled antibody. (B) FACS histograms from a representative experiment. (C) Bar diagram shows means ± S.E.M. from three independent experiments. Statistically significant differences were examined using repeated-measures ANOVA followed by Bonferroni’s multiple comparison. (D–F) Freshly isolated murine and human HPSC were pretreated in vitro with either vehicle (open bars) or 10 μM treprostinil and 30 μM forskolin (closed bars) for 1 hour at 37°C followed by washing steps. A suspension (2 × 10⁵ cells in 0.1 ml of medium containing growth factors) of human (D) or murine HSPCs (E, F) was added to the upper chamber of a Transwell and allowed to migrate toward SDF-1 (100 ng ml−1 in the lower chamber) for 4 hours. Cells that had migrated through the 5-μm filter were counted. HSPCs were also incubated in the absence and presence of 10 μM AMD3100 to confirm that the effects arose from a stimulation of CXCR4 (F). Data represent ± S.E.M. from three independent experiments carried out in triplicate. The statistical comparison was done by repeated-measures ANOVA followed by Tukey’s multiple comparison (*P < 0.05, **P < 0. 01, ***P < 0.001).

