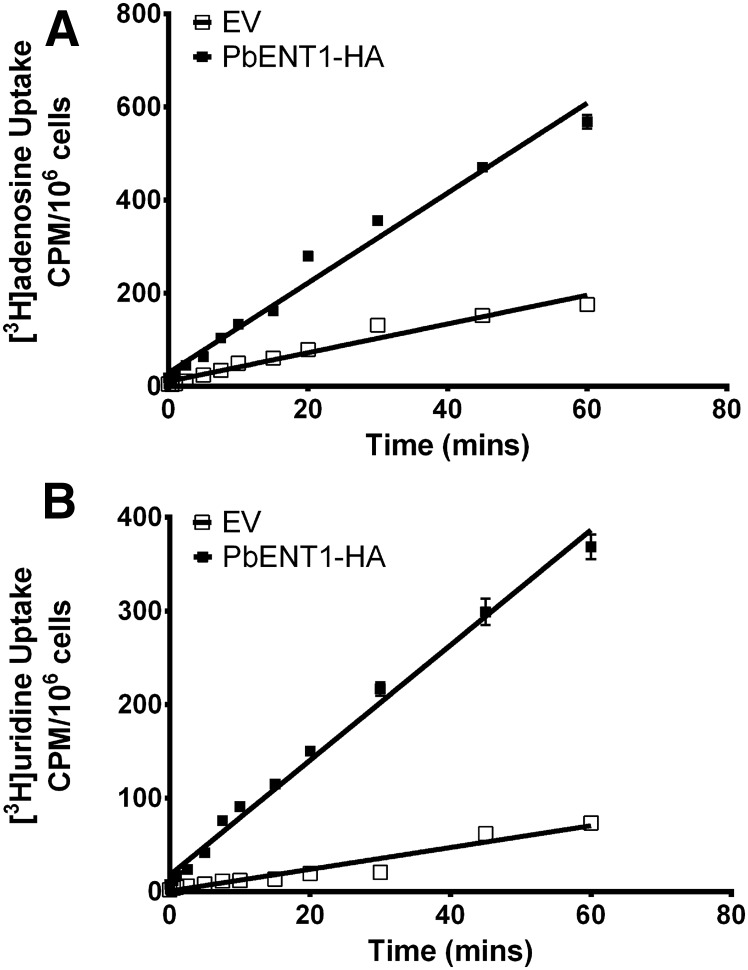
Fig. 2.
Time course of uptake of [3H]adenosine and [3H]uridine into PbENT1-HA–expressing purine auxotrophic yeast. (A and B) Uptake of 50 nM [3H]adenosine (A) and 250 nM [3H]uridine (B) into PbENT1-HA–expressing yeast. Open boxes represent yeast transformed with EV. Filled boxes represent yeast expressing PbENT1-HA. Uptake is measured in counts per minute (CPM) per million cells. Note differing y-axis scales in the two panels. Data shown are the average of three independent experiments.

