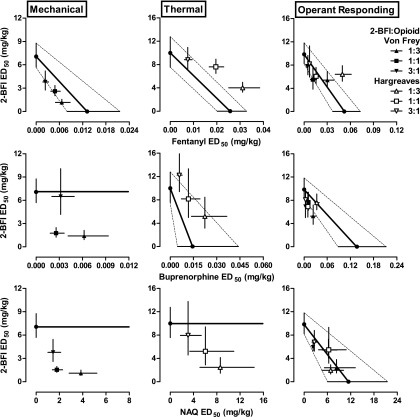
Fig. 4.
Isobolograms constructed from the data shown in Fig. 3. (Top row) Isobolograms for 2-BFI/fentanyl mixture for mechanical nociception (left), thermal nociception (middle), and responding rate (right). (Middle row) Isobolograms for 2-BFI/buprenorphine mixture for mechanical nociception (left), thermal nociception (middle), and responding rate (right). (Bottom row) Isobolograms for 2-BFI/NAQ mixture for mechanical nociception (left), thermal nociception (middle), and responding rate (right). Ordinate: ED50 value (95% CL) of 2-BFI (mg/kg); abscissa: ED50 value (95% CL) of μ-opioid receptor ligand (mg/kg).

