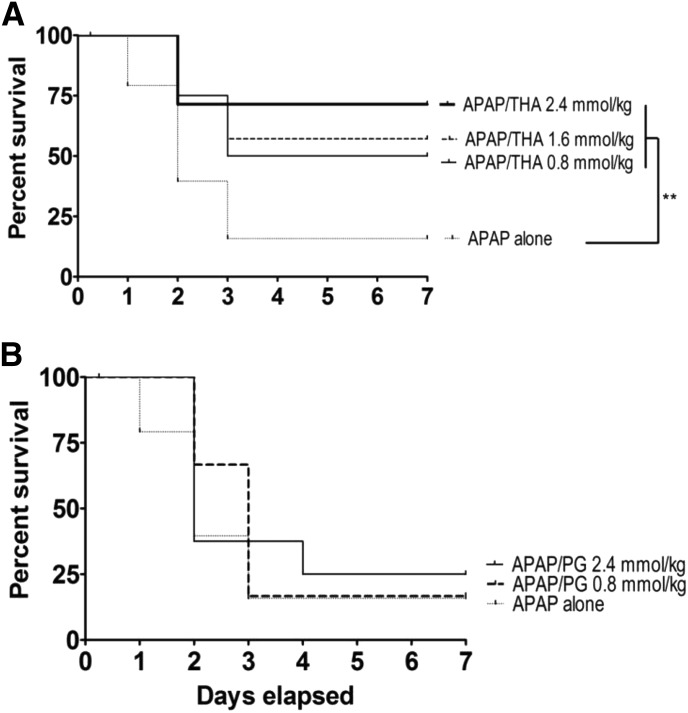
Fig. 3.
(A) Kaplan–Meier survival curves illustrating the effects of oral THA (0.80–2.40 mmol/kg) on oral APAP (500 mg/kg)–induced lethality in mice (n = 10–15/group). Joining line indicates statistically significant differences in treatment groups. **P < 0.01. (B) Effects of oral PG (0.80–2.40 mmol/kg) on oral APAP (500 mg/kg)–induced lethality in mice (n = 10–15/group). Statistically significant differences were not determined among experimental groups.

