Fig. 6.
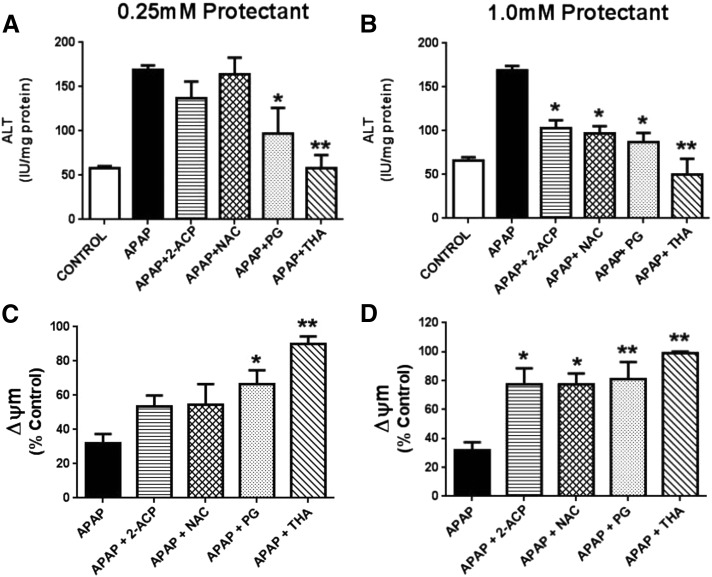
This figure is a continuation of analyses presented in Fig. 5. Here we describe the respective effects of 0.25 mM or 1.0 mM protectant on ALT appearance in media (A and B) and changes in mitochondrial membrane potential (ΔΨm; C and D) in isolated mouse hepatocytes exposed to 1.0 mM APAP (× 4 hours) as per Fig. 5. ALT data are expressed as mean IU/mg protein ± S.E.M. (n = 6–8) and changes in ΔΨm are expressed as mean percent of control ± SEM (n = 6–8). Also measured were AST and LDH media levels that showed mean changes equivalent to those of ALT (data not shown). *P < 0.05; **P < 0.01 (levels of significance relative to the APAP-alone control data). ALT, alanine aminotransferase; AST, aspartate aminotransferase; LDH, lactate dehydrogenase.

