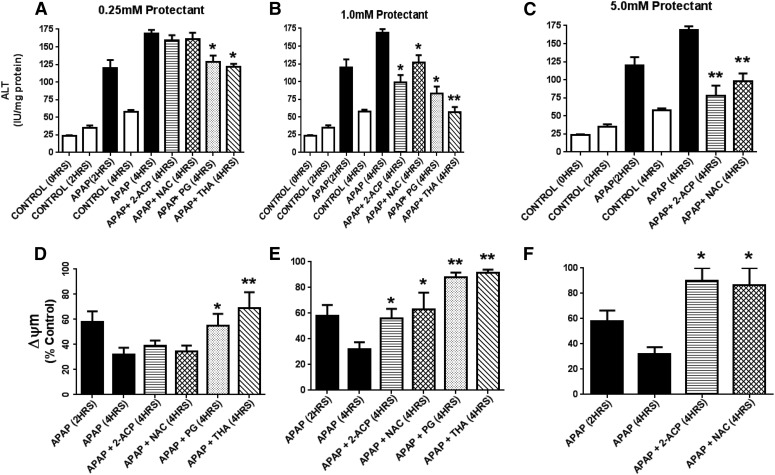
Fig. 9.
This figure is a continuation of our analysis presented in Fig. 8. Here we describe the effects of graded protectant concentrations (0.25–5.0 mM) added 2 hours after APAP exposure on ALT appearance in media (A–C) and changes in mitochondrial membrane potential (ΔΨm; D–F) in isolated mouse hepatocytes exposed to 1.0 mM APAP. Parameters were measured at 4 hours after APAP exposure as per Fig. 8. ALT data are expressed as mean IU/mg protein ± S.E.M. (n = 6–8) and changes in ΔΨm are expressed as mean percent of control ± S.E.M. Also measured were AST and LDH media levels that showed mean changes equivalent to those of ALT (data not shown). *P < 0.05; **P < 0.01 (levels of significance relative to the APAP-alone control data). ALT, alanine aminotransferase.

