Fig. 2.
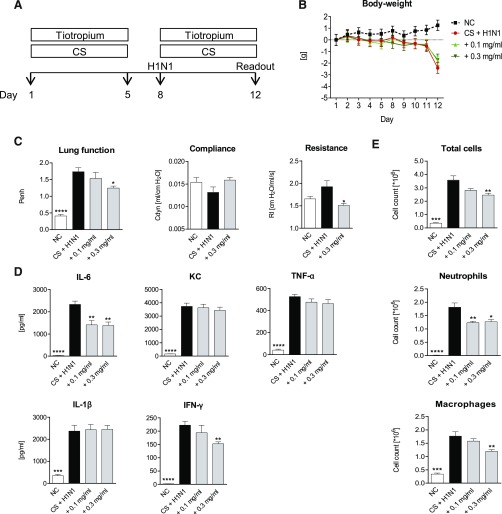
Tiotropium treatment of CS-exposed and H1N1-infected mice. (A) CS-exposed and H1N1-infected mice (black bars) were treated for a total of 10 days with 0.1 mg/ml or 0.3 mg/ml nebulized tiotropium (gray bars). White bars show the results from untreated negative control (NC) animals. (B) Body weight loss in NC mice (black dotted line), untreated CS-exposed, and H1N1-infected mice (red line); CS-exposed and H1N1-infected mice treated with 0.1 mg/ml (light green line); or 0.3 mg/ml (dark green line) nebulized tiotropium. (C) Lung function, resistance, compliance, and (D) cytokine levels in lung homogenate and (E) total cell, neutrophil, and macrophage numbers in BAL fluid. Mean values ± S.E.M. of n = 7 or 8 animals in the HIN1- and CS-exposed mice groups and n = 4 in the NC group. ****P < 0.0001, ***P < 0.001, **P < 0.01, and *P < 0.05 represent significant differences compared with CS-exposed and H1N-infected group.

