
Fig. 5.
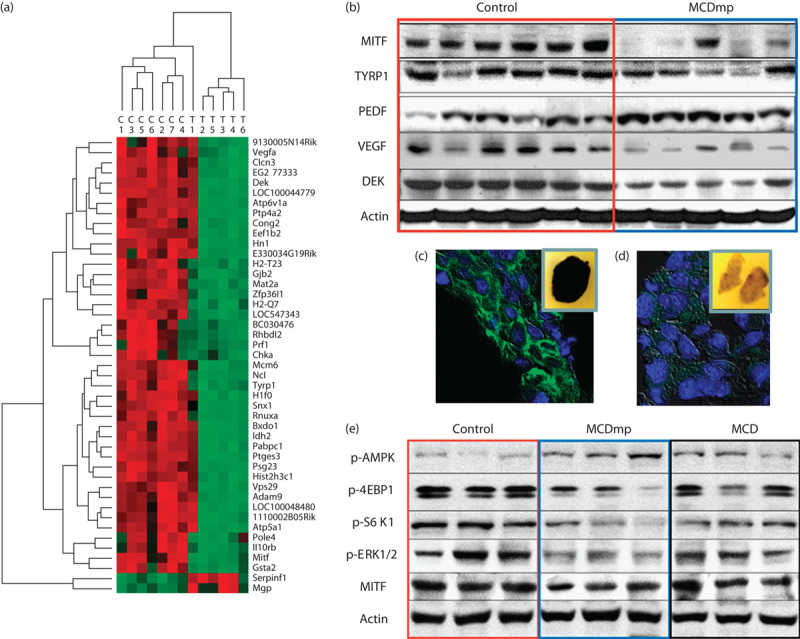
Diet-induced melanoma growth-suppression mechanism. (a) cDNA microarray analysis using melanoma tissues removed from the control and the MCDmp groups showed significant alterations in gene expression. Red represents upregulated mRNAs and green represents downregulated mRNAs. (b) The melanoma-specific proliferation markers, MITF and TYRP1, were decreased in the MCDmp group along with inhibition of VEGF, activation of the endogenous angiogenesis inhibitor (PEDF), and downregulation of the DEK oncogene. (c) Confocal analysis confirmed significantly decreased TYRP1 expression in the MCDmp group (green; anti-TYRP1, blue; DAPI). Inset images represent gross cut-sections of paraffin-embedded tumor tissue blocks showing decreased pigmentation in the MCDmp group. (d) Compared with MCD intervention, the MCDmp group showed higher expression of p-AMPK with suppression of the 4-EBP1, S6K1, ERK1/2, and MITF.