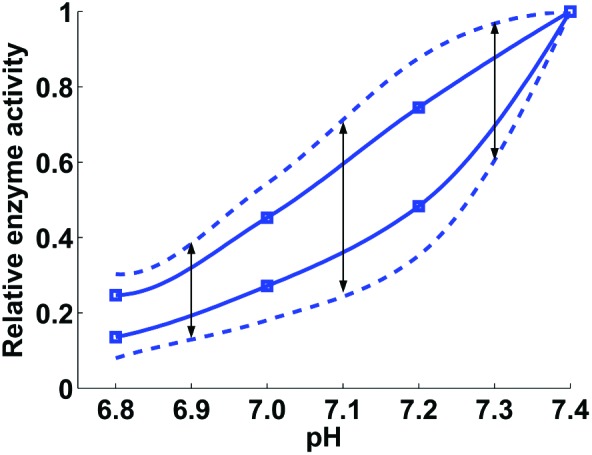
Figure 1.

Relative enzyme activity as a function of pH. For every considered acidotic pH level, the pH factor values (which express enzymatic activity relative to that at pH 7.4) were sampled uniformly from the interval delimited by the dashed lines at that pH level. For the pH levels of 6.9, 7.1, and 7.3, such intervals are indicated by black arrows. The dashed lines were obtained by increasing (by 100%) the distance between the solid lines, which approximate the experimental data (extracted from Figs. 2 and 3 in Meng et al.13) shown with square markers. The markers on the upper and lower solid lines correspond to the enzymatic activity of the extrinsic tenase and prothrombinase coagulation factor complexes, respectively. The solid lines were fitted to the experimental data using the MATLAB function PCHIP. See Supplemental Digital Content for further details.
