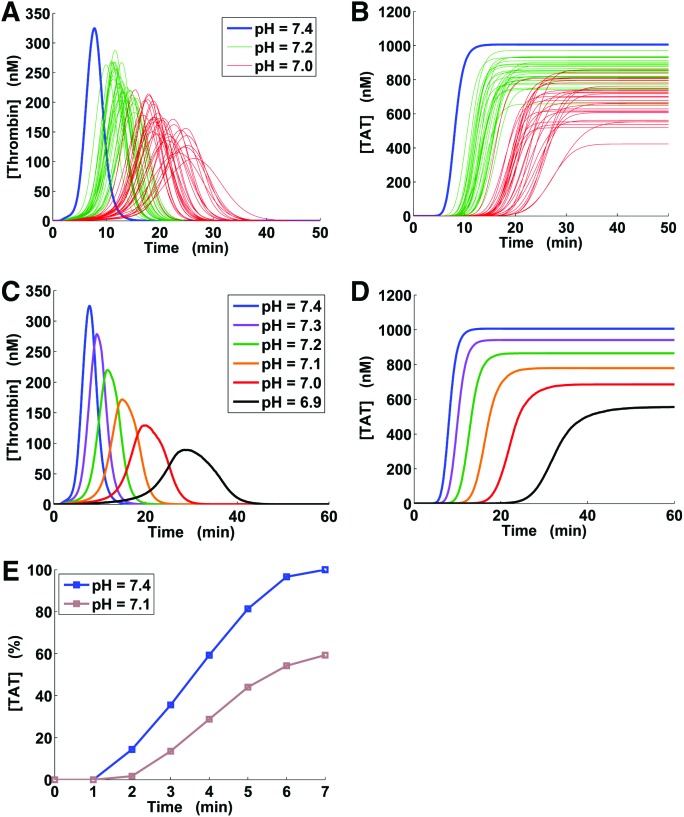
Figure 2.
Thrombin generation versus time under physiological and acidotic conditions. TAT = thrombin-antithrombin complex. Subplots A and B: each subplot shows 30 green and 30 red kinetic trajectories, with each trajectory corresponding to a randomly generated set of pH factors; the blue lines correspond to trajectories at the physiological pH level. Subplots C and D represent kinetic trajectories at the physiological pH level (blue) and median trajectories corresponding to the 5000-trajectory groups computed for acidotic pH levels (other colors) as described in Methods (via the full pH-dependence simulation strategy). E, Normalized thrombin-antithrombin complex (TAT) data on induced acidosis for an in vivo porcine model; the data values are designated with square markers and were extracted from Figure 5 in Martini et al.9

