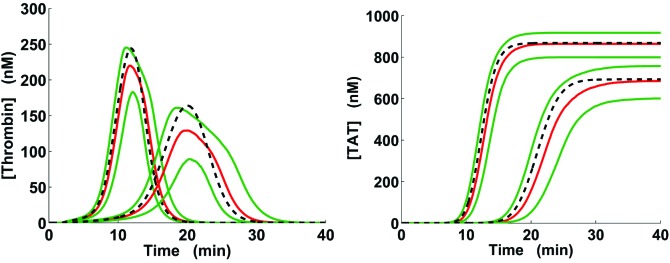
Figure 3.
Thrombin generation ranges for acidotic pH levels. Solid green and red lines correspond to the interquartile range and median, respectively, calculated for the groups of 5000 kinetic trajectories generated via the full pH-dependence simulation strategy as described in Methods (the medians, also shown in Fig. 2, C and D, are shown here for comparison purposes). The dashed lines correspond to the acidotic-pH kinetic trajectories calculated using our reduced pH-dependence simulation strategy. For each subplot, the left and right groups of trajectories correspond to pH 7.2 and 7.0, respectively.

