Figure 4.
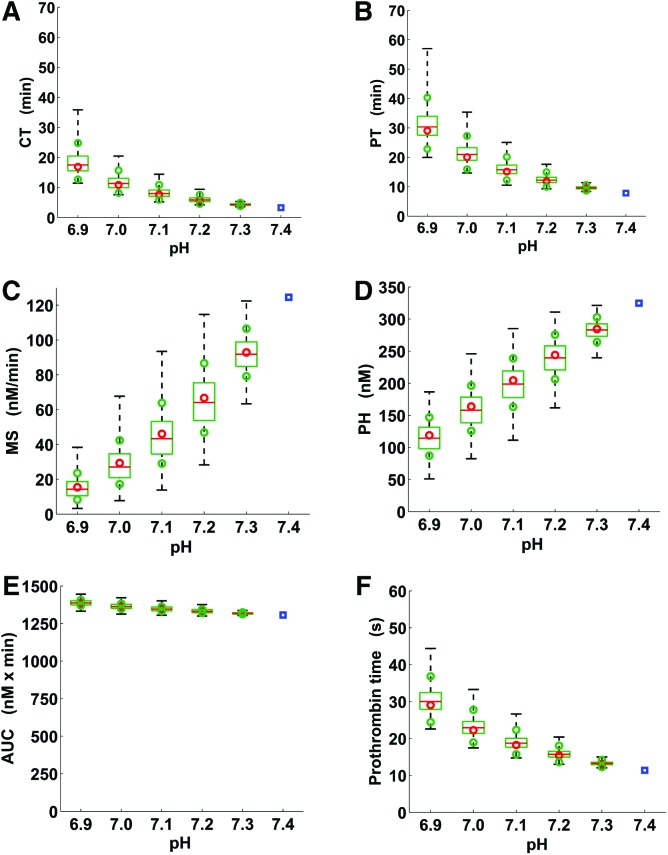
Box and whisker plot of the quantitative parameters of thrombin generation trajectories under physiological and acidotic pH conditions. A, Clotting time; B, Thrombin peak time; C, Maximum slope of the thrombin trajectory; D, Thrombin peak height; E, Area under the thrombin trajectory (or “curve”); F, Prothrombin time. The blue squares correspond to single values for physiological pH, whereas the box plots show thrombin generation parameter distributions corresponding to the groups of 5000 thrombin trajectories generated via the full pH-dependence simulation strategy. Dashed whiskers, green boxes, and red lines show the ranges, interquartile ranges, and medians of the parameter distributions, respectively. The red circles correspond to the estimates of the median values calculated using our reduced pH-dependence simulation strategy (see Methods). The green circles were calculated similarly to the red circles as an estimate of the interquartile ranges shown as green boxes. Acidosis-induced median fold changes in the area under the thrombin trajectory with respect to its physiological value were smaller than corresponding median fold changes for every other thrombin generation parameter (P = 0 to machine precision, Wilcoxon rank sum test; comparisons for each acidotic pH level performed independently.) For each (acidotic) thrombin trajectory and each thrombin generation parameter, fold_change = AV/NV if AV > NV and fold_change = NV/AV otherwise, where AV and NV are the (acidotic) value of the parameter for that thrombin trajectory and the parameter’s physiological value, respectively.

