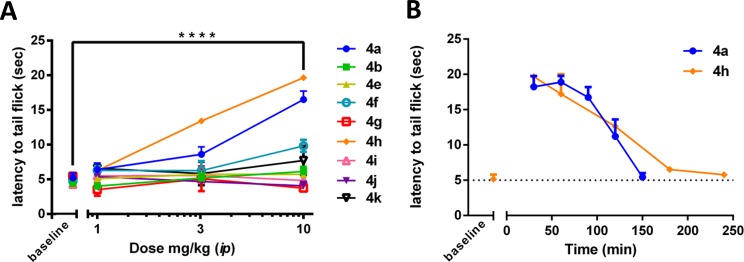
Figure 2.
(A) Cumulative antinociceptive dose response curves of select benzyl pendant analogues (n = 3 for all analogues) in the mouse WWTW assay following ip administration. Plotted as average ± SEM. ****, p < 0.0001 for 4a and 4h for the 10 mg/kg dose when compared to baseline, p < 0.001 for 4f when compared to baseline (not indicated on graph). (B) Time course of antinociception of 4a and 4h (n = 3) in the mouse WWTW assay following ip administration of 10 mg/kg. Plotted as average ± SEM. Data for 4a from ref (8).

