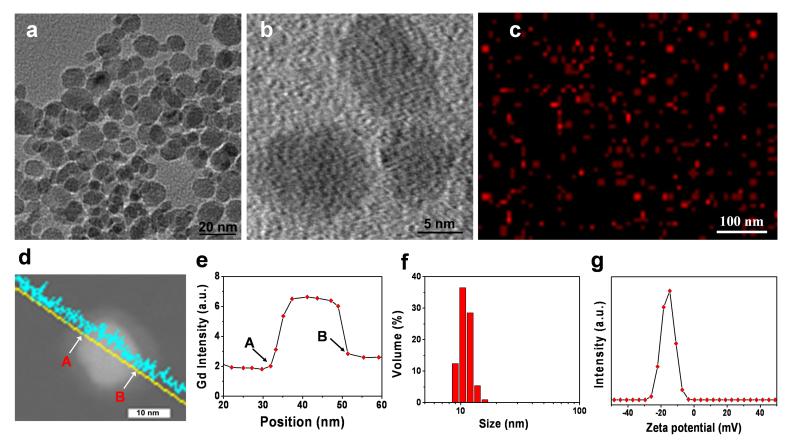
Figure 1.
Characterizations of Gd@C-dots. (a) TEM and (b) HRTEM images of Gd@C-dots. (c) Elemental mapping (Gd) of Gd@C-dots. (d) STEM image of a single Gd@C-dot. (e) EDX line profile across the nanoparticle in d. Points “A” and “B” corresponded to those labeled respectively in d. (f) DLS analysis result of Gd@C-dots. (g) Zeta potential of Gd@C-dots.

