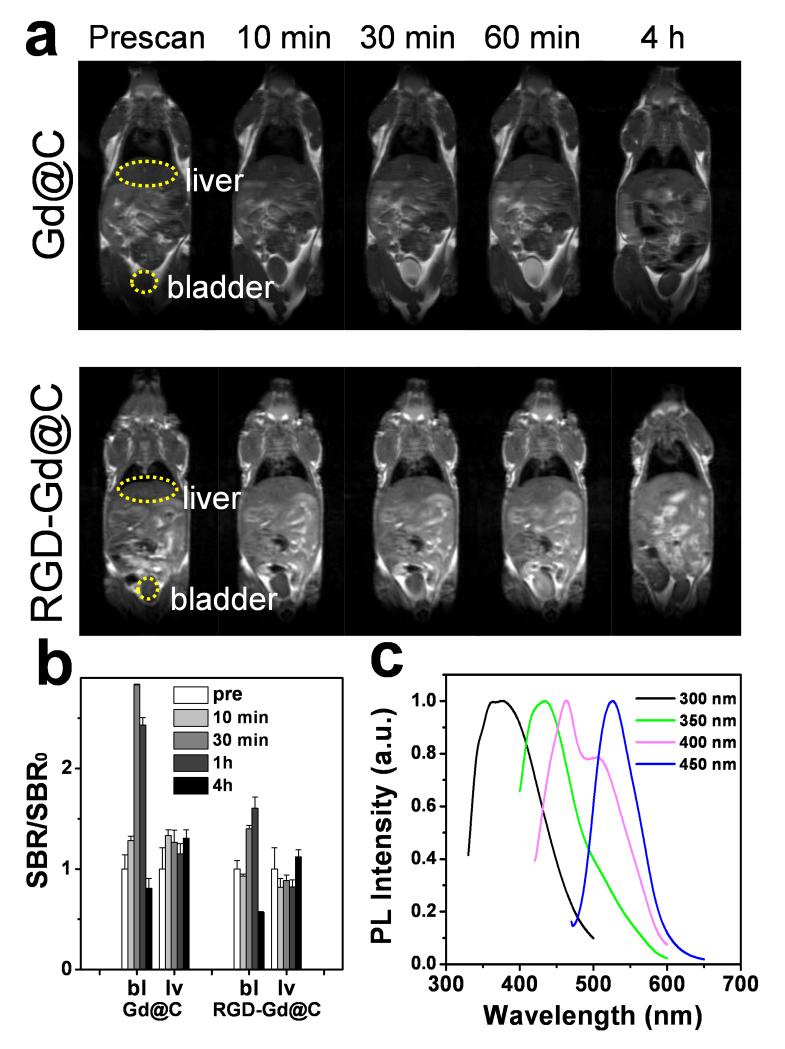
Figure 4.
(a) T1-weighted MR images, acquired at different time points after injection of Gd@C-dots or RGD-Gd@C-dots. (b) Signal change in the bladder (bl) and liver (lv), based on region of interest (ROI) analysis on images from a). (c) Photoluminescence analysis on urine samples, taken 60 min after the injection of RGD-Gd@C-dots.

