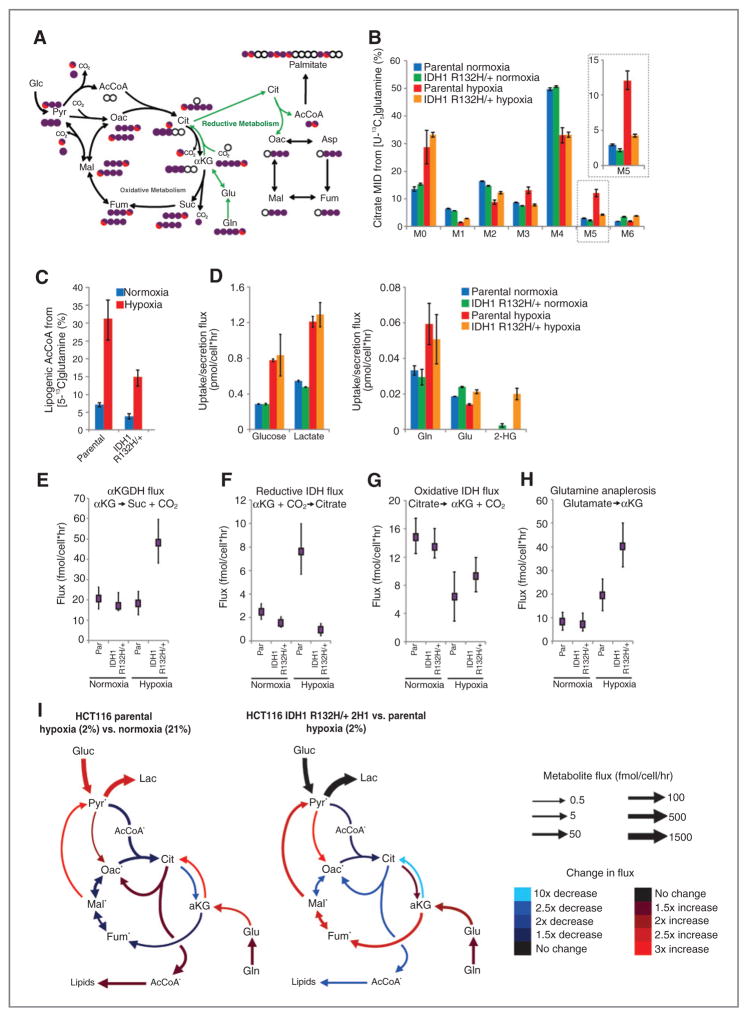
Figure 1.
Isogenic IDH1 mutation compromises metabolic reprogramming under hypoxia. A, carbon atom (represented by circles) transitions and tracers used to detect changes in flux: [U-13C5]glutamine (purple circles) or [5-13C]glutamine (circle with red). The fifth carbon is lost during oxidative TCA metabolism but is retained on citrate, AcCoA, and palmitate in the reductive pathway (green arrows). B, citrate MID labeling from [U-13C5]glutamine from HCT116 parental and HCT116 IDH1 R132H/+ clone 2H1 cells cultured in normoxia or hypoxia (2% oxygen) for 72 hours. Data, representative of more than three independent experiments. Inset highlights changes in % M5 citrate. C, contribution of [5-13C]glutamine to lipogenic AcCoA from cells cultured as in Fig. 1B. D, uptake and secretion fluxes for cells cultured as in Fig. 1B. E–H, α-Ketoglutarate dehydrogenase (E), reductive IDH (F), oxidative IDH (G), and glutamine anaplerosis (H) flux estimates and 95% confidence intervals by the 13C MFA model. I, graphical representation of fluxes determined via MFA. Arrow thickness, level of flux in HCT116 cells cultured in hypoxia. Color, fold difference between hypoxic and normoxic parental HCT116 cells (left) or between hypoxic HCT116 IDH1 R132H/+ 2H1 cells and hypoxic HCT116 parental cells (right).*, metabolites that were modeled as existing in separate mitochondrial and cytosolic pools. aKG, α-Ketoglutarate; cit, citrate; fum, fumarate; gluc, glucose; glu, glutamate; gln, glutamine; lac, lactate; mal, malate; oac, oxaloacetate; pyr, pyruvate. See also Supplementary Methods, Supplementary Fig. S2, and Supplementary Tables S1–S4 for details of MFA model, results, and data.

