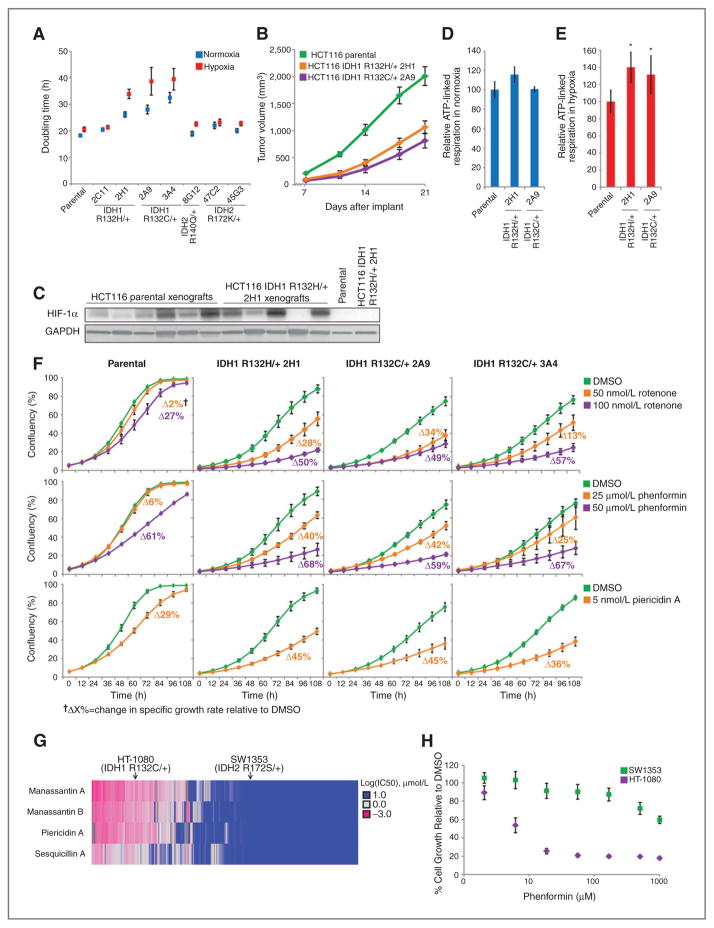
Figure 6.
Cells expressing mutant IDH1 are sensitive to pharmacologic inhibition of mitochondrial oxidative metabolism. A, doubling times of HCT116 cells cultured in normoxia or hypoxia (2% oxygen) for 72 hours. B, growth curves for HCT116 parental and IDH1-mutant xenografts. C, Western blot showing HIF1α expression in HCT116 parental and HCT116 IDH1 R132H/+ 2H1 cells grown in normoxia in cell culture (last two lanes) or as xenografts. D, ATP-linked oxygen consumption for the indicated cell lines grown in normoxia. E, ATP-linked oxygen consumption for the indicated cell lines grown in hypoxia (3% O2). F, growth charts from cells cultured as indicated. Images were acquired every 12 hours to measure confluency. Change in growth relative to DMSO treatment (ΔX%) was calculated using a generalized logistics growth model for batch culture and represents the change in the specific growth rate relative to the DMSO treatment for the indicated cell line. G, heatmap displaying IC50 values to four inhibitors of mitochondrial metabolism for more than 500 cancer cell lines; HT-1080 and SW1353 cells are indicated. H, growth of HT-1080 and SW1353 cells under the indicated concentration of phenformin for 48 hours.

