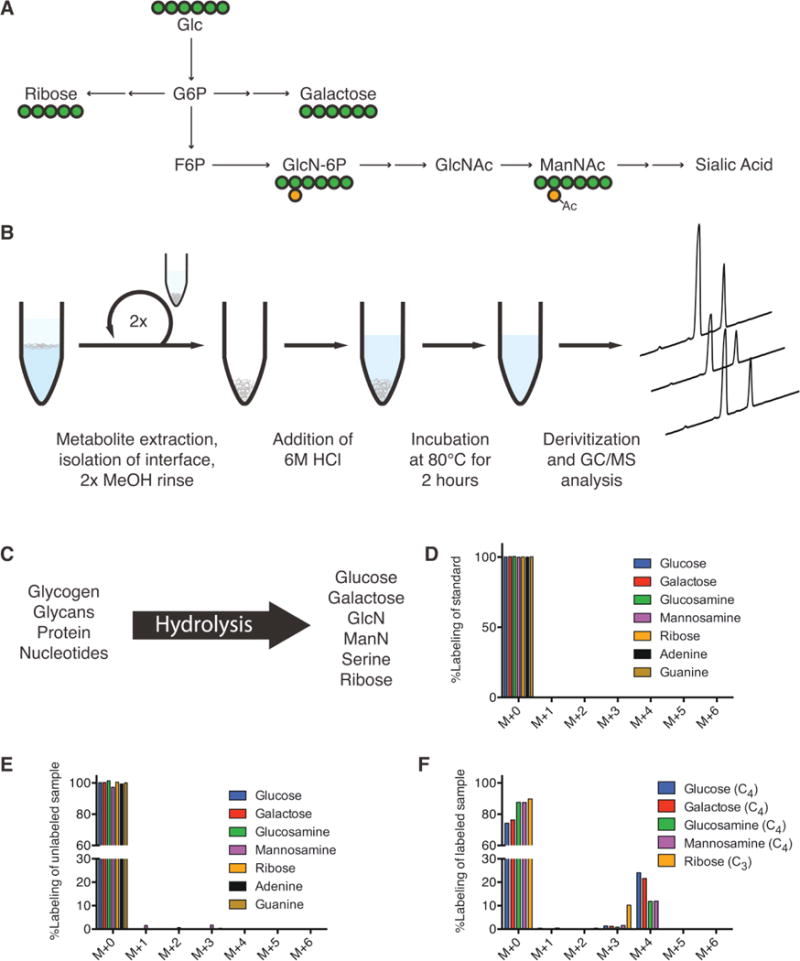
Figure 2.

Quantitation of glycan residue abundance and labeling in cellular biomass. (A) Atom-transition map depicting flow of [U-13C6]glucose (UGlc) into ribose, galactose, and hexosamines. Green circles depict carbon atoms and orange circles depict nitrogen atoms. (B) Schematic of biomass hydrolysis method. Insoluble interface layer is isolated from initial methanol/water/chloroform quench/extraction, rinsed twice with methanol, and acid hydrolyzed. (C) Diagram of detectable metabolites after acid hydrolysis. Major macromolecules (nucleotides, protein, glycans) are broken down into primary components (ribose/nucleobases, amino acids, sugars/amino-sugars, respectively), which can be measured on GC/MS. (D) Corrected mass isotopomer distribution (MID) of each metabolite standard. Corrected M + 0 peak equal to unity ensures accuracy of MIDs. (E) Corrected MID of metabolites from unlabeled cell hydrolysates. Corrected M + 0 peak deviation from unity is informative of MID accuracy and potential contaminating fragments in hydrolysates. (F) Corrected MID of metabolites measured in hydrolysates from hESCs labeled using UGlc. Glucose, galactose, glucosamine, and mannosamine fragments have four carbons labeled from glucose. Ribose has three carbons labeled from glucose. Error bars represent SD (E–F) for three independent hydrolysates.
