Figure 4.

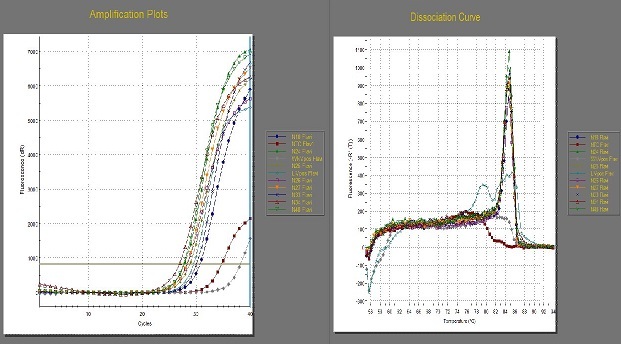
Two-step RT-qPCR amplification plots of 8 RNA samples using pan-flavivirus primers and the corresponding dissociation curves

Two-step RT-qPCR amplification plots of 8 RNA samples using pan-flavivirus primers and the corresponding dissociation curves