
Figure 6.
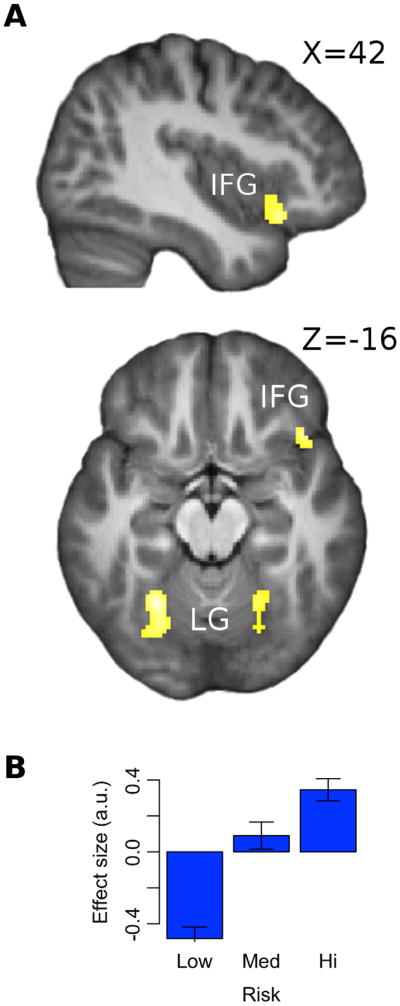
(a) SPM showing effects of risk at time of cue at right inferior frontal gyrus [IFG; peak at x,y,z = 56,16,-6] and bilateral lingual gyrus [LG; peaks at x,y,z = 18,-52,-2; x,y,z = -26,-56,-16]; shown at pFWE < 0.05 after extent thresholding. (b) Bar plot shows the average effect of low, medium and high risk at inferior frontal gyrus. To generate this, trials were sorted according to their risk value into one of three equal-sized bins, which were then fitted to the BOLD signal. Error bars indicate SEM.