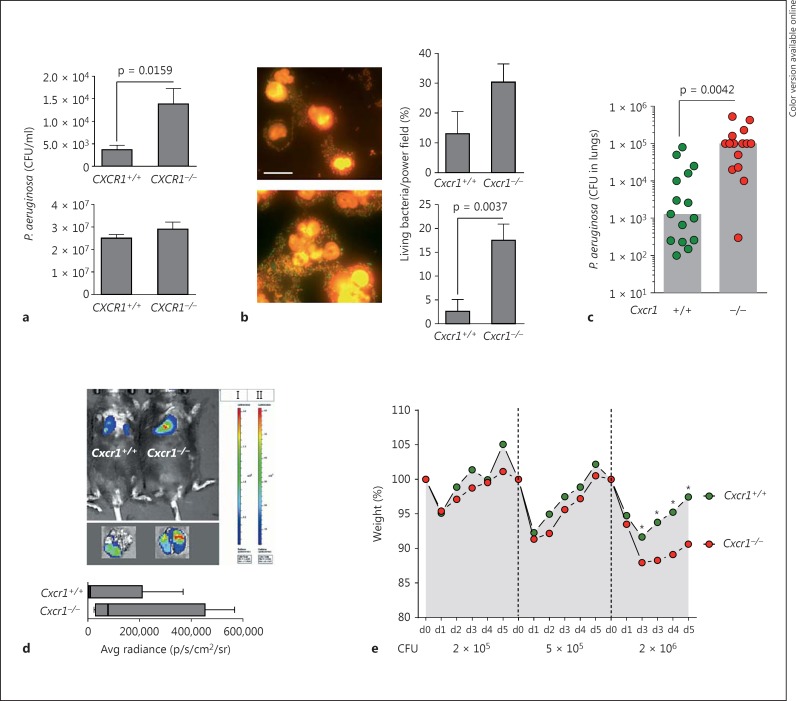
Fig. 1.
P. aeruginosa infections. a Intracellular killing (upper panel) and extracellular killing (lower panel). Bone marrow-isolated neutrophils from age- and sex-matched Cxcr1+/+ and Cxcr1−/− mice were infected with PAO1 for 60 min at MOI 50, and CFU were counted. Data are from 5 independent experiments (means, SEMs). b GFP-PAO1 bacteria and bone marrow-isolated neutrophils from age- and sex-matched Cxcr1+/+ and Cxcr1−/− mice were coincubated for 7 or 60 min at MOI 50. Bacteria were stained using a live/dead bacterial staining kit (left) and quantified microscopically (right). Representative images of Cxcr1+/+ (upper left) and Cxcr1−/− (lower left) neutrophils 60 min after GFP-PAO1 infection are shown. Living bacteria are shown in green and dead bacteria in red. Scale bar: 10 µm. Bars show percentages of living bacteria at 7 min (upper right) and 60 min (lower right) at MOI 50. Data are from 5 independent experiments (means, SEMs). c-e Age- and sex-matched Cxcr1+/+ and Cxcr1−/− mice were infected intranasally (c, e) or intratracheally (d) with PAO1 (except for d, luciferase-expressing TBCF10839 isogenic mutant D8A6). Lung CFU (c), bacterial lung in vivo clearance (d) and weight loss (e) were monitored. For these experiments, 2 × 10⁶ CFU (c), 5 × 10⁷ (d) or 2 × 10⁵ to 2 × 10⁶ CFU PAO1 (e) were inoculated. c Bars represent medians; CFU were quantified in lungs 12 h after infection. d Bioluminescence imaging was performed 24 h after the infection for 5 (Cxcr1+/+) or 4 (Cxcr1−/−) independent experiments; box and whiskers (range: min/max, quartiles, medians) are shown. e Mean weight points for days 0-5 (d0-d5) are shown. * p < 0.05 Cxcr1+/+ versus Cxcr1−/− mice.

