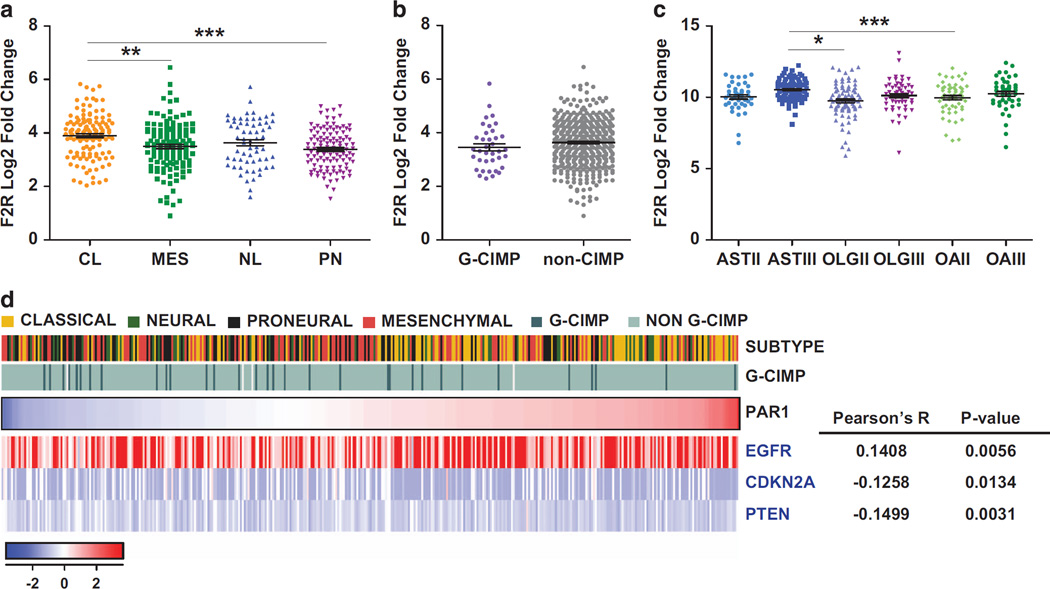
Figure 2.
Analysis of PAR1 expression in relation with TCGA-defined glioblastoma subtypes and copy number variations (a–b), PAR1 gene expression was enriched in the CL subtype of GBM defined by the TCGA (n= 483) relative to normal brain tissue (n = 10) (a) but was not correlated with the glioma-Cpg Island Methylator Phenotype (G-CIMP) subtype. (b, c) Expression value of PAR1 gene expression in low-grade gliomas (n = 468) derived from the TCGA showing a significant enrichment of PAR1 in anaplastic AST, relative to grade II OLG and OA. Black lines in each group indicate mean ± s.e.m. 1 way ANOVA, P < 0.0001; *P < 0.05; **P < 0.01; ***P < 0.001 after Tukey’s multiple test comparison. (d) PAR1 expression was significantly correlated with EGFR, PTEN and CDKN2A copy number variations. AST, astrocytoma; CL, classical; OLG,: oligodendroglioma; OA, oligoastrocytoma; II and III: WHO grades II and III, respectively; MES, mesenchymal; NL, neural; PN: proneural.

