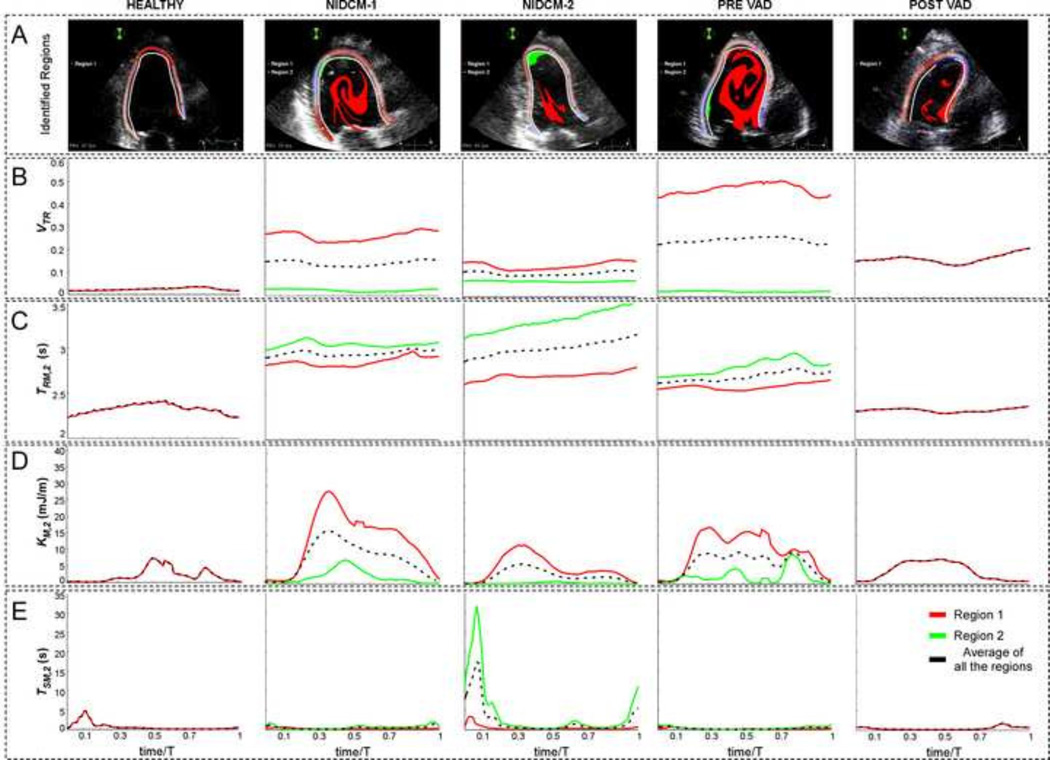
FIGURE 5.
Example of region tracking (A) and time evolution of VTR (B), TM,2 (C), KM,2 (D), TSM,2 (E) along the last converged cycle in all the 2-D studied cases: Healthy heart (1st col), NIDCM-1 (2nd col), NIDCM-2 (3rd col), Pre-VAD (4th col) and Post-VAD (5th col). Line colors correspond to each of the tracked regions (row A) and their average (black).

