Figure 4.
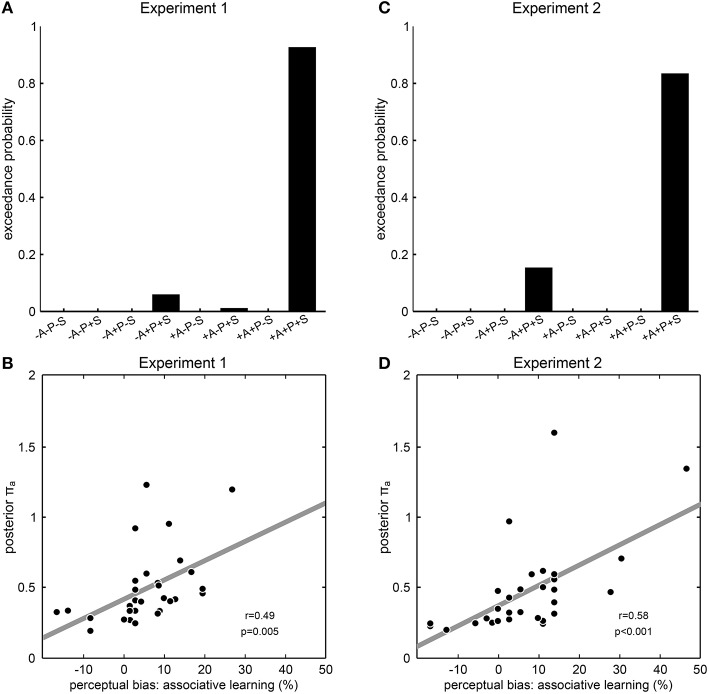
Modeling results from Experiment 1 and 2. (A,C) Results of model comparison. The model names at the y axis specify eight models with all possible combinations of the prior distributions “associative learning” (A), “priming” (P) and “sensory memory” (S), where “+” means that the corresponding prior distribution was included and “−” means that the corresponding prior distribution was excluded. Exceedance probabilities were derived by random-effects Bayesian model selection as implemented in SPM8. Exceedance probability refers to the probability that a model is more likely, at the group level, than any other model considered. In both experiments, the model +A+P+S including all prior distributions clearly outperformed all other models that lacked one, two or all of the prior distributions. (B,D) Correlation between model parameters and behavior. The posterior parameter estimates for the precision of the prior distribution “associative learning” from the winning model +A+P+S is correlated across participants with the perceptual bias induced by associative learning. Each dot represents one participant; the dashed line illustrates the fitted regression line; r- and p-values result from Pearson's product-moment correlations.

