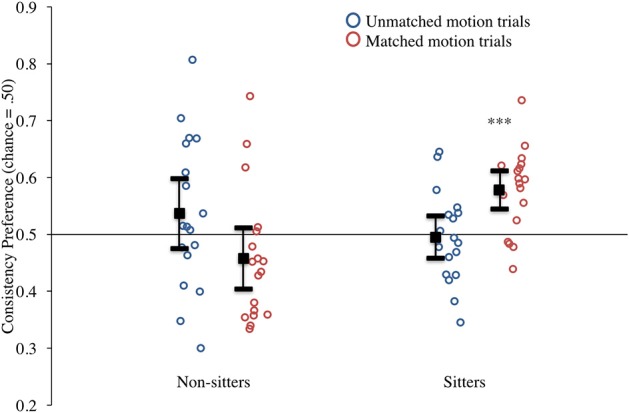
Figure 3.

Experiment 1 consistency preference scores for non-matched and matched motion trials by sitting status. Circles represent individual infants, solid black square represents mean responding. (Note: ***denotes p < 0.001, error bars represent 95% confidence intervals).
