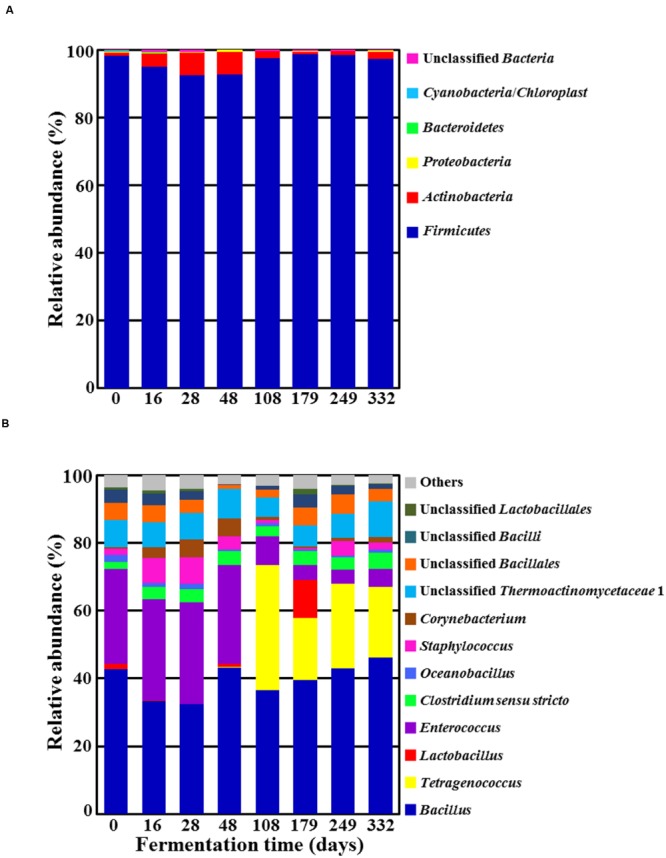
FIGURE 3.

Taxonomic classification at the phylum (A) and genus (B) levels showing bacterial community fluctuations during doenjang fermentation. “Others” in (B) refers to genera exhibiting a read percentage<1.0% of the total reads in all doenjang samples.
