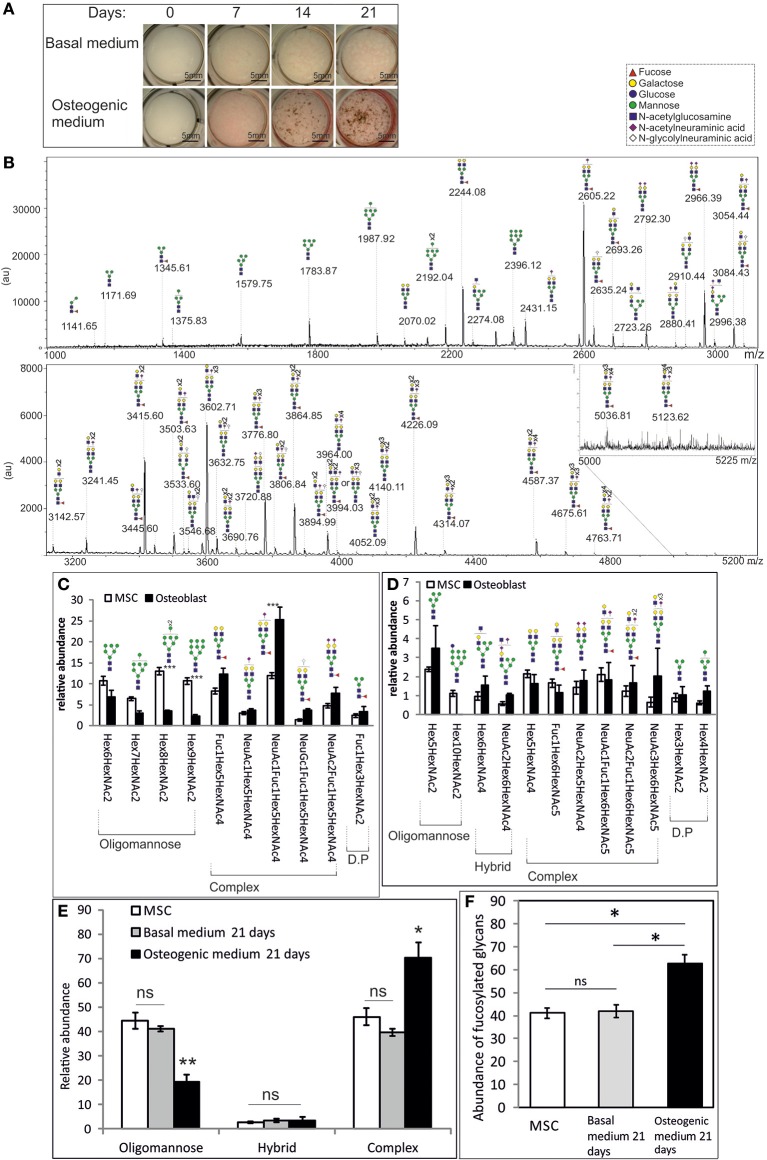
Figure 2.
Osteogenic differentiation significantly alters the N-glycan profile of MSCs. (A) Brightfield images of Y101 hTERT-MSCs cultured in basal (top row) or osteogenic (bottom row) media, stained for alkaline phosphatase (pink) and phosphate (von Kossa, brown), sampled at weekly intervals. (B) A representative MALDI-TOF spectrum of permethylated N-glycans isolated from osteoblasts cultured for 21 days as in (A). Presented as in Figure 1. (C–F) Comparisons of averaged (Y101 n = 5, osteoblast n = 3) normalized total peak intensities of: (C) Individual glycan structures with abundances above 3% of the total. (D) Individual glycan structures with abundances of 1–3% of the total. D.P, degradation product, most likely produced in the lysosome. (E) Sums of different glycan types. (F) Sums of all fucosylated glycan abundances. Error bars show standard error of the mean. In (E, F) the “Basal medium 21 days” sample was harvested following culture in basal medium for 21 days (n = 2). For a representative spectrum of this sample see Supplementary Figure 1. *P < 0.05, **P < 0.01, ***P < 0.001.

