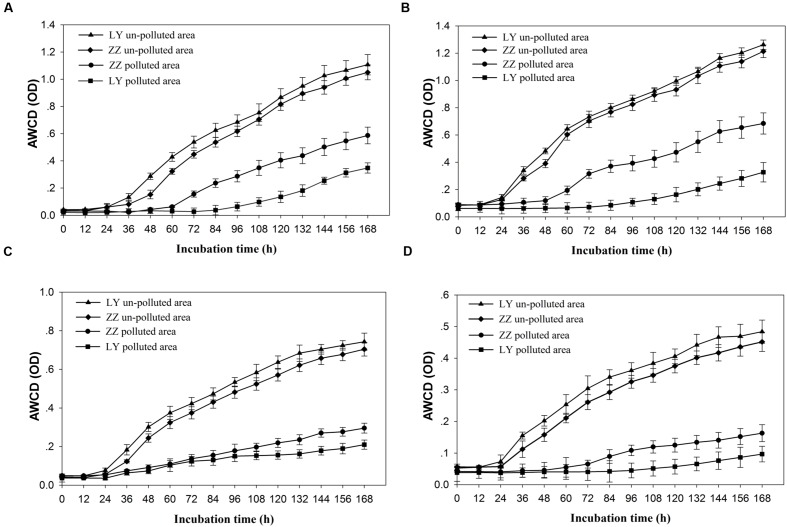
FIGURE 2.
Utilization of four kinds of carbon sources by soil microbial community from different sampling areas. (A–D) Representing the amino acid and its derivates (AD), sugar and its derivates (SD), fatty acid and its derivates (FD), or secondary metabolites (SM), and average well color development (AWCD) indicating the average value of three replicated results of one Biolog-Ecoplate. LY and ZZ mean Liuyang and Zhuzhou City, respectively.

