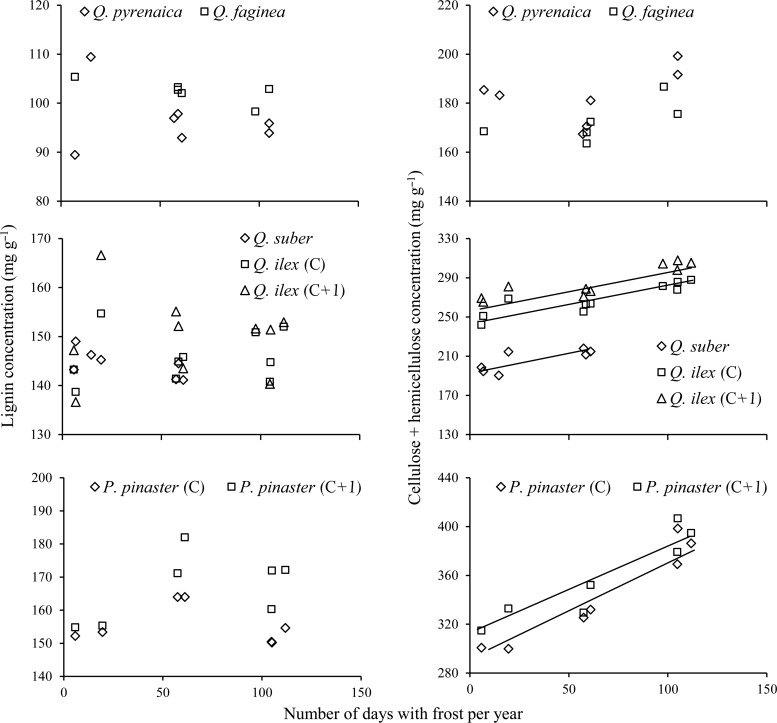
Figure 4.
Relationships between the number of days with frost per year at each site and fibre concentration in the different leaf types. Each point is an average of eight sampling dates for current-year (C) leaves and 12 for 1-year-old (C + 1) leaves. Fitted equations for cellulose + hemicellulose concentrations: Q. suber (y = 0.34x + 195, R2 = 0.61, P = 0.04), Q. ilex C (y = 0.33x + 247, R2 = 0.78, P = 0.0008), Q. ilex C + 1 (y = 0.35x + 264, R2 = 0.79, P = 0.0005), P. pinaster C (y = 0.90x + 285, R2 = 0.92, P = 0.0007) and P. pinaster C + 1 (y = 0.77x + 308, R2 = 0.86, P = 0.0025). No significant relationships were observed for lignin concentration. Quercus pyrenaica and Q. faginea produced no significant relationships for any variable.

