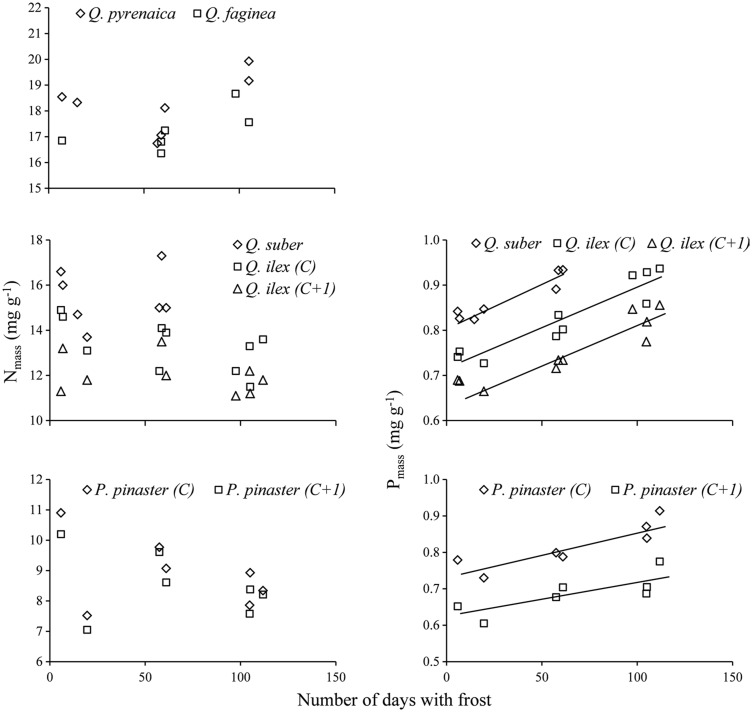
Figure 5.
Relationships between the number of days with frost per year in each site and nitrogen (Nmass) and phosphorus (Pmass) concentrations in the different leaf types. Each point is an average of eight sampling dates for current-year (C) leaves and 12 for 1-year-old (C + 1) leaves. Fitted equations for P concentrations: Q. suber (y = 0.0018x + 0.815, R2 = 0.89, P = 0.0015), Q. ilex C (y = 0.0018x + 0.716, R2 = 0.88, P < 0.0001), Q. ilex C + 1 (y = 0.0015x + 0.658, R2 = 0.84, P < 0.0001), P. pinaster C (y = 0.0013x + 0.733, R2 = 0.78, P = 0.0087) and P. pinaster C + 1 (y = 0.0010x + 0.622, R2 = 0.63, P = 0.0334). Phosphorus concentrations were not available for Q. pyrenaica and Q. faginea.

