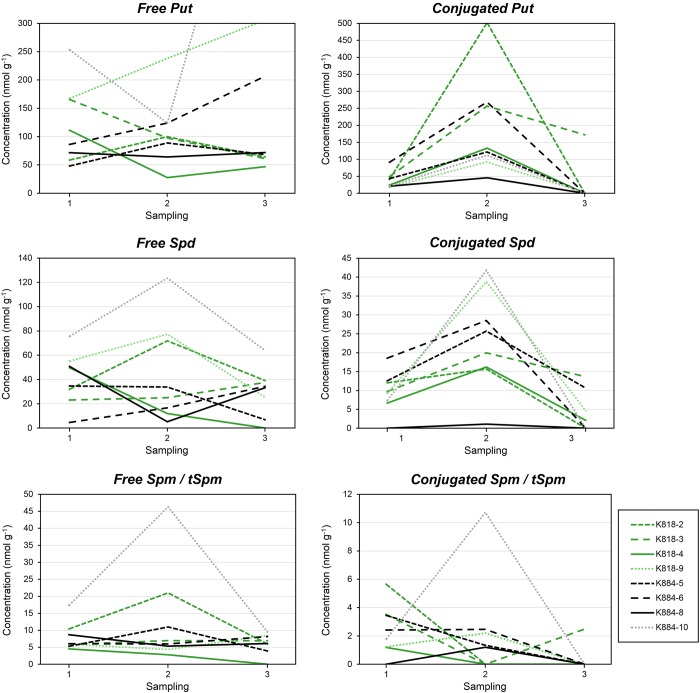
Figure 1.
Free and soluble conjugated PA concentrations (nmol g−1 FW) in Scots pine embryogenic cell masses representing different cell lines during the induction of SE. The SE lines originated from the mother trees K818 (gray lines (green lines online)) and K884 (black lines). From the young SE lines, two (solid lines) out of six produced embryos and four did not (dashed lines). The old SE lines are marked with small dash (with lighter colors online). Every observation point represents an arithmetic mean from two PA analyses.

