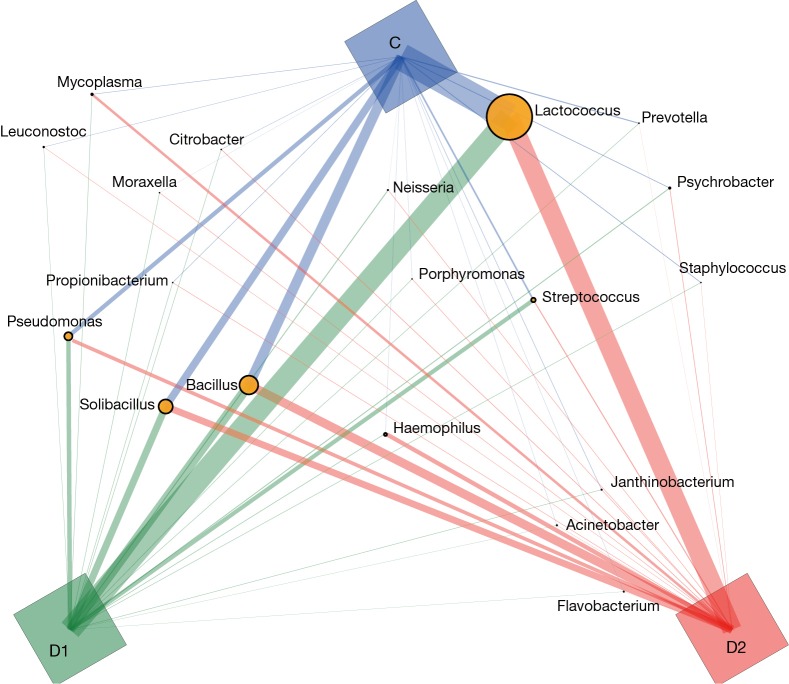
Figure 1.
Bacterial structure in C, D1 and D2 group, at genus level. SVG (version 1.1) was used to produce the paragraph, based on relative abundance of each genus. The circle square of each genus represents total relative abundance in three groups, and the line linking C, D1 and D2 group means relative abundance for each group (proportional to line thickness). SVG, Scalable Vector Graphics.

