Figure 3.

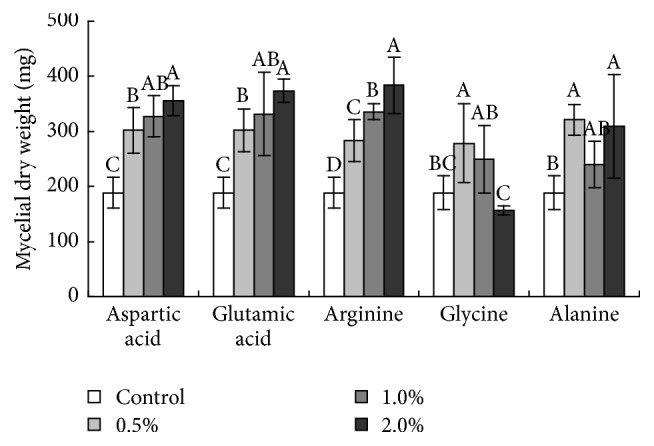
Effects of amino acids on A. flavus growth. The data represent the mean ± SD. Letters indicate statistically significant differences (P < 0.05) for each amino acid, and all treatments consisted of five replicates.

Effects of amino acids on A. flavus growth. The data represent the mean ± SD. Letters indicate statistically significant differences (P < 0.05) for each amino acid, and all treatments consisted of five replicates.