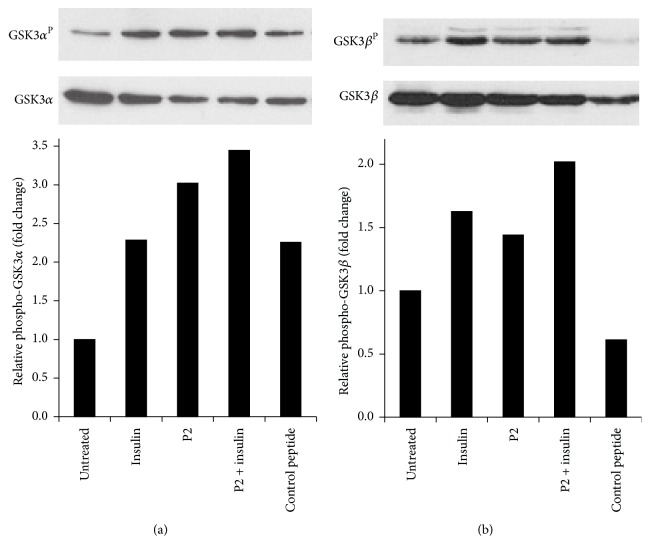
Figure 6.
P2 inactivates GSK3. (a) Phosphorylation of GSK3α in P2-stimulated cells. Lysates of cells treated as in Figure 5(a) were analyzed by Western blot; the blot was probed sequentially with antibodies to phospho-GSK3α-S21 and GSK3α. The signals were quantified by densitometry as in Figure 5. (b) Phosphorylation of GSK3β in P2-stimulated cells. Identical samples to those in (a) were probed with anti-phospho-GSK3β-S9 antibody, followed by anti-GSK3β; signals were quantified as in (a).

