Fig. 5.

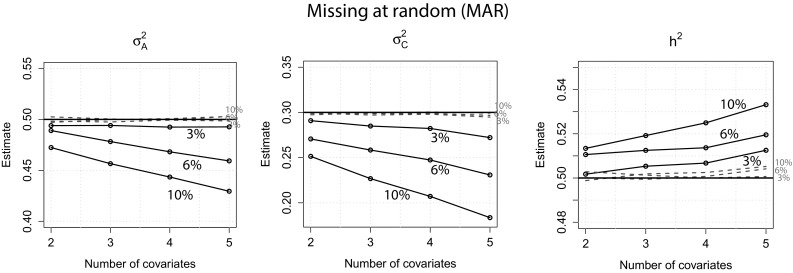
MAR: Estimates of , and of both approaches when 2, 6 and 10 % of the covariate data were missing. Dotted lines full information approach. The horizontal lines denote the true values of , and

MAR: Estimates of , and of both approaches when 2, 6 and 10 % of the covariate data were missing. Dotted lines full information approach. The horizontal lines denote the true values of , and