
Figure 2.
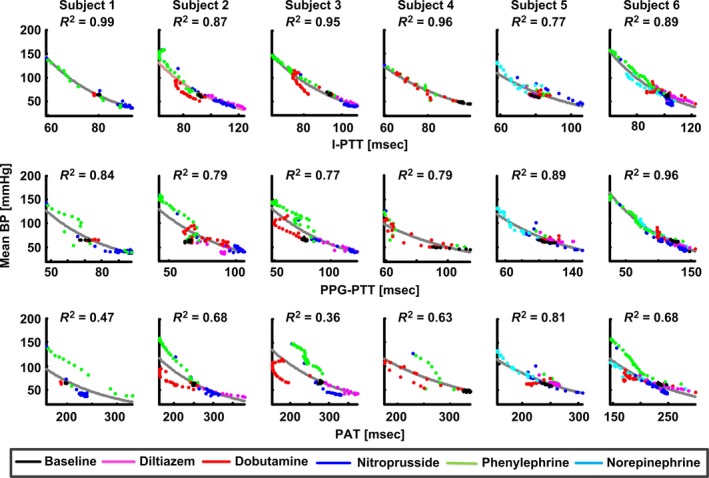
Plots of mean BP versus I‐PTT, PPG‐PTT, and PAT per subject along with best‐fit exponential functions and corresponding R 2 values.
Official websites use .gov
A
.gov website belongs to an official
government organization in the United States.
Secure .gov websites use HTTPS
A lock (
) or https:// means you've safely
connected to the .gov website. Share sensitive
information only on official, secure websites.
Plots of mean BP versus I‐PTT, PPG‐PTT, and PAT per subject along with best‐fit exponential functions and corresponding R 2 values.