Figure 2.

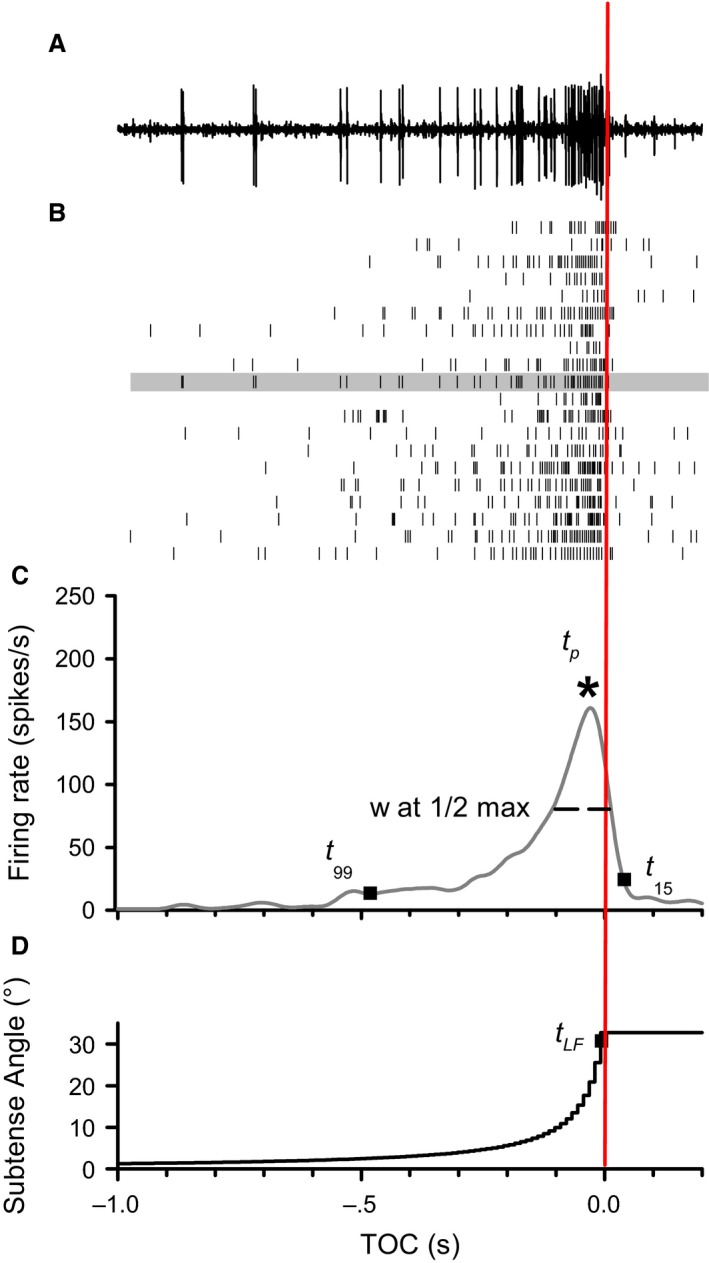
Responses to a frontal looming object against a simple background. (A) Individual raw neural recording from the left DCMD. (B) Raster plots of spike times during the approach (n = 20 locusts). Shaded rasters indicate spike times from the recording in A. (C) Mean DCMD peristimulus time histogram from all rasters in B. Labeled points on the DMCD response indicate the specific times used to calculate rise and fall phases. The start of the rise phase (t 99) is when the firing rate exceeded a 99% confidence interval, and ended when the DCMD firing rate peaked (t p ). The start of the fall phase was the time of the last frame of expansion (t LF in D) and ended at the time of the nearest spike to 15% of the peak firing rate (t 15). See Materials and Methods for a description of the calculation of TOT‐associated rise and fall phases (now shown). We also measured the number of spikes during approach, the amplitude and time, relative to TOC, of the peak firing rate (*), the duration of the peak at ½ peak amplitude (PW½M). See text for details on measurements associated with a time of transition. (D) The increasing visual subtense angle for a 7 cm black disk during a frontal loom. All panels time aligned to the projected time of collision (TOC, red vertical line).
