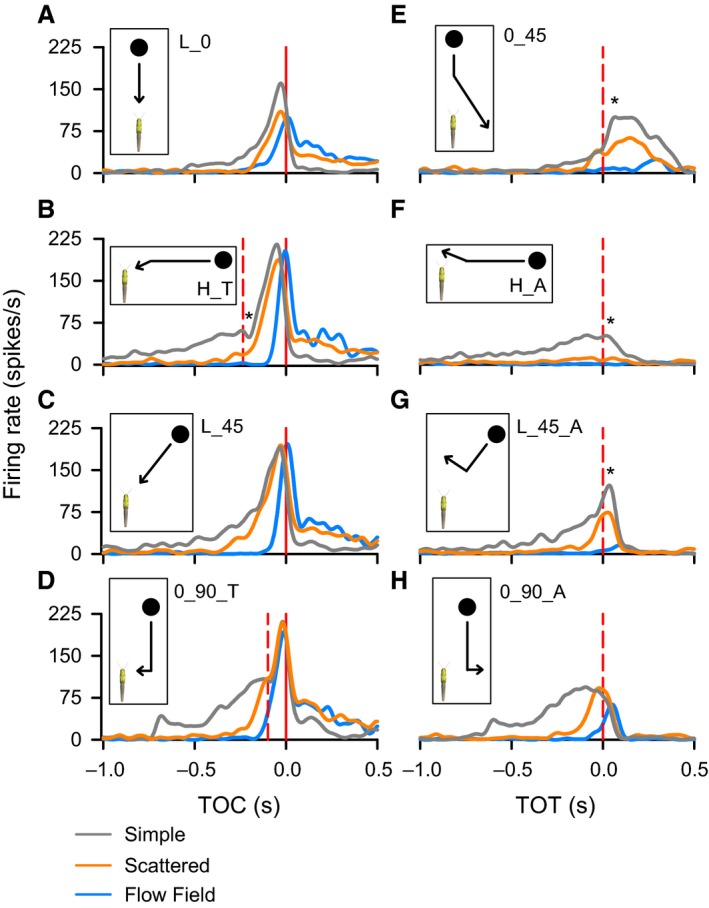
Figure 4.

Mean DCMD responses to a 7 cm black disk travelling along eight unique trajectories against three different backgrounds. Peristimulus time histograms (PSTHs) of the DCMD show responses to the different categories of object motion (insets). Red solid vertical line in A–D represents TOC. The red dashed vertical line in B, D, E–H represents TOT, backgrounds represented by colored lines in the PSTHs: Simple (gray), Scattered (orange), Flow Field (blue). Asterisks indicate the time of a local valley (B) or peak (E, F, G,) in response to a transition.
