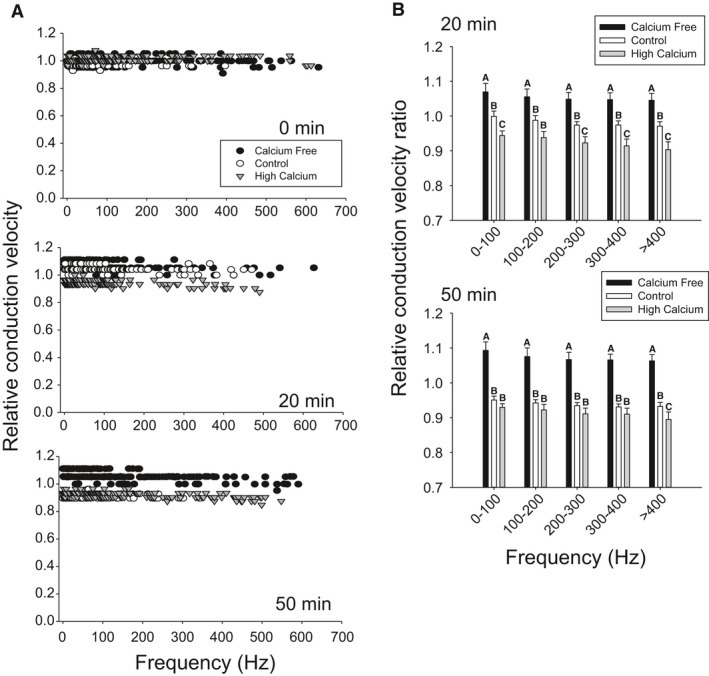
Figure 5.

Calcium removal increases CV in the DCMD at high temperature. (A) Representative relative CV profiles at 35°C show opposite effects of calcium free (calcium‐free saline with 1 mmol/L EGTA) and high calcium (saline with 8 mmol/L calcium) at 20 and 50 min of exposure. (B) Calcium‐free saline (n = 6) produced a significant increase in CV across all frequencies compared to controls (n = 7) at 20 and 50 min (P < 0.05). High calcium (n = 5) produced an initial reduction in CV at 20 minutes across most frequencies but after 50 min, controls had slowed to equal high calcium in all but the >400 Hz band (Two RM ANOVA with Holm–Sidak pairwise multiple comparisons, df = 2, F > 18 for all frequencies, P < 0.001 for all frequencies). Data are plotted at mean and SE. Letters indicate significant differences (P < 0.05).
