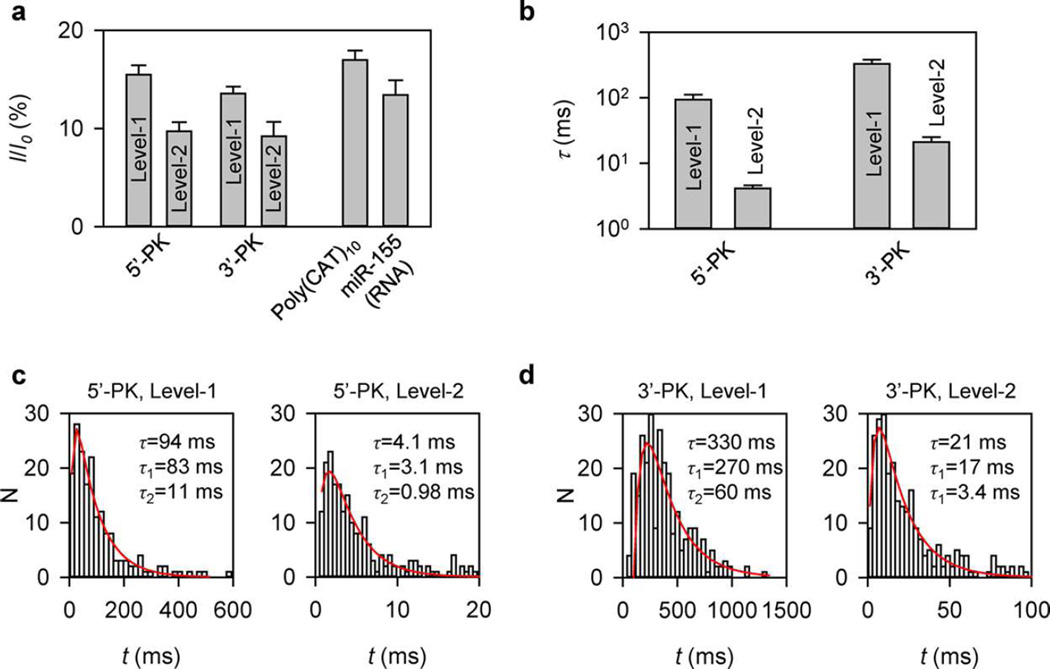
Figure 3.
Characteristic blocking levels and durations of different steps in signatures of pseudoknots and control oligonucleotides. (a) Relative conductance (I/I0, I and I0 are current amplitudes of the block and empty pore) of Level-1 and Level-2 blocks in the 5′-PK and 3′PK signatures shown in Figure 2b and c, and blocks generated by DNA Poly(CAT)10 and RNA miR-155 translocation through the pore. Blocks of Poly(CAT)10 and miR-155 were analyzed in Figure S3. (b) Durations of Level-1 and Level-2 stages in the 5′-PK and 3′-PK signatures. (c,d) Representative histograms of Level-1 (left) and Level-2 (right) durations for 5′-PK (N = 245) (c) and 3′-PK (N = 272) (d). The duration distributions in histograms were fitted with N(t) = A/(τ1 − τ2)[e−1t/τ1−e−t/τ2], based on a two-step kinetic pathway111 (see Figure S10 for the fitting method). The duration of each level τ was the sum of fitted τ1 and τ2.

