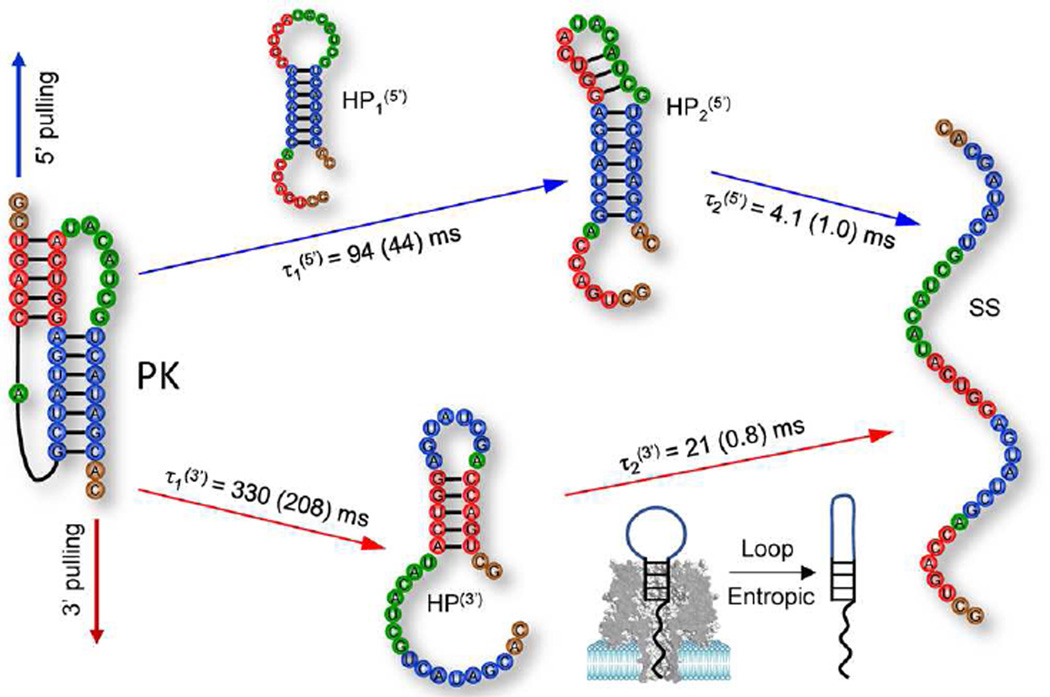
Figure 6.
Predicted pathways of the nanopore unfolding of the T2 pseudoknot for the pulling from the 5′ end (blue) and from the 3′ end (red), respectively. Experimental dwell times and the mean first passage times (FPT) from KMC simulations (in parentheses) for the different steps are shown for comparison. The large difference of τ2(3′) (11 ms vs 0.8 ms) may be accounted for by the pausing time for the 8-nt loop in hairpin HP(3′) to overcome (mainly entropic) kinetic barrier to form compact conformations so HP(3′) can pass through the cis opening of the nanopore. In our model, we used g(V) = 1.8 kcal mol−1. Assuming g(V) = -Qeff·V as the electric potential-induced reduction in the energy barrier with V = 120 mV for the potential drop across the nanopore in the experimental setup, we found the effective net charge Qeff ≈ 0.7 e for the chain inside the pore.68 Noted that Qeff is sensitive to the molecular types and the solution conditions, such as ion concentrations and pH value.

