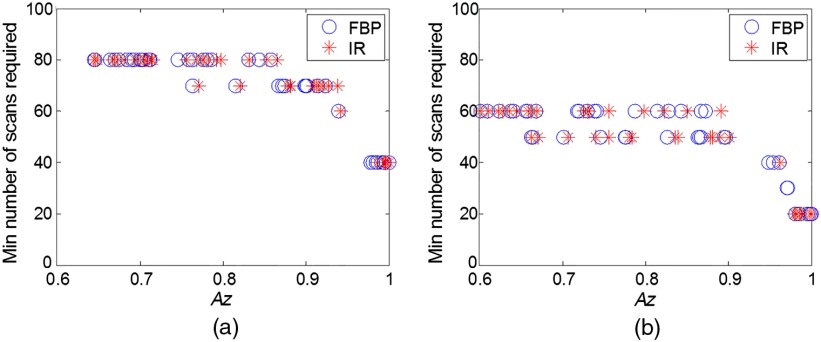
Fig. 12.
Scatter plot of the minimum required number of scans as a function of low-contrast detectability expressed in . Each scatter point in the plot represents the value at certain object size, contrast level, and dose level. (a) Forty channels in the Gabor filter (four passbands, five orientations, and one phase) and (b) 20 channels in the Gabor filter (four passbands, five orientations, and one phase).

