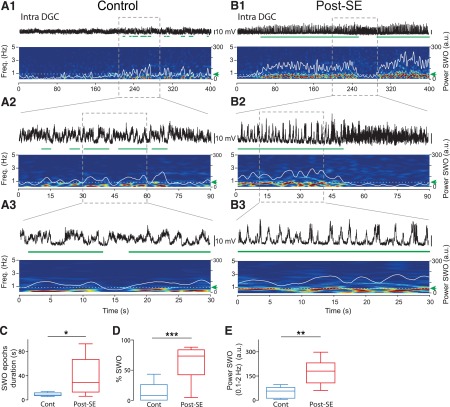
Figure 3.
Increased slow-oscillatory epochs in the membrane potential of dentate granule cells in post-SE rats. A, B, Examples of detected SWO epochs in the membrane potential of dentate granule cells from a control rat (A) and a post-SE rat (B; spikes digitally removed). In each panel, the Vm (top), time–frequency power spectrogram (bottom) and time-varying power in the SWO band (0.1-2 Hz; superimposed white line) are represented at low (1) intermediate (2), and high (3) temporal resolution. In all cases, green horizontal bars below the trace highlight detected SWO epochs (Scale bars in B, same as in A). C, Box plots of the duration of single SWO epochs detected in the Vm of DGCs in control (n = 6) and post-SE (n = 8) conditions. D, Box plots of the percentage of recording time with significant oscillations in the SWO frequency range in the Vm of DGCs in control (n = 10) and post-SE (n = 8) rats. E, Box plots of the power in the SWO frequency range averaged over all recorded cells and recording times in the Vm of DGCs in control (n = 10) and post-SE (n = 8) rats. For these and subsequent box plots, the box extends from the 25th to 75th percentile. The line in the middle of the box is the median. The whiskers go down to the smallest value and up to the largest. *p < 0.05; **p < 0.01; ***p < 0.001.

